Population – A multi-faceted pyramid

Kit Yee
Is our reality a pyramid or ponzi scheme…
“The world needs a new model of how to generate a rising standard of living that’s not dependent on a pyramid scheme…”
Nobel Laureate Steven Chu
Here in Singapore where our political masters have a hand in all aspects of life – economic, financial, social, healthcare, military – the issue of low fertility rates has thus become a multi-faceted one. To the extent that the government even once dabbled for some years in matchmaking amongst singles. While we’re all too familiar with the consequences of low fertility rates, this consciousness resides only at the national level with little discernible impact in our daily lives except in textbooks or in ways too subtle to notice except during elections.
Nonetheless, more are slowly starting to notice the implications and the costs of pursuing individual goals at the expense of national objectives. Immigration has been the first port of call in the list of solutions with Singapore’s local resident population now standing at around 60% – eateries, construction sites, tech firms, banks are all now staffed visibly with foreigners. Schools are merging as a consequence of reduced student intakes and the military now grapples with a much smaller conscript cohort, sparking concerns of a controversial but possible expansion of the regimen to females.
What is perhaps less noticeable we feel, but will hit home harder, are the long term implications on the fiscal balance, not just in Singapore, but globally. A ponzi or a pyramid scheme relies heavily on a steady influx or inflow of new investors or entrants, to sustain the steady and continuous payouts made to earlier and existing investors or entrants. However, a reduction in the influx eventually necessitates a corresponding and controlled diminution in payouts, without which a collapse becomes inevitable. Ironically, as simple as this logic seems, human nature rejects any such diminution as it represents a breach of promise or trust and defeats the entry objective in the first place, even if a zero outcome if all but certain. Does this sound familiar?
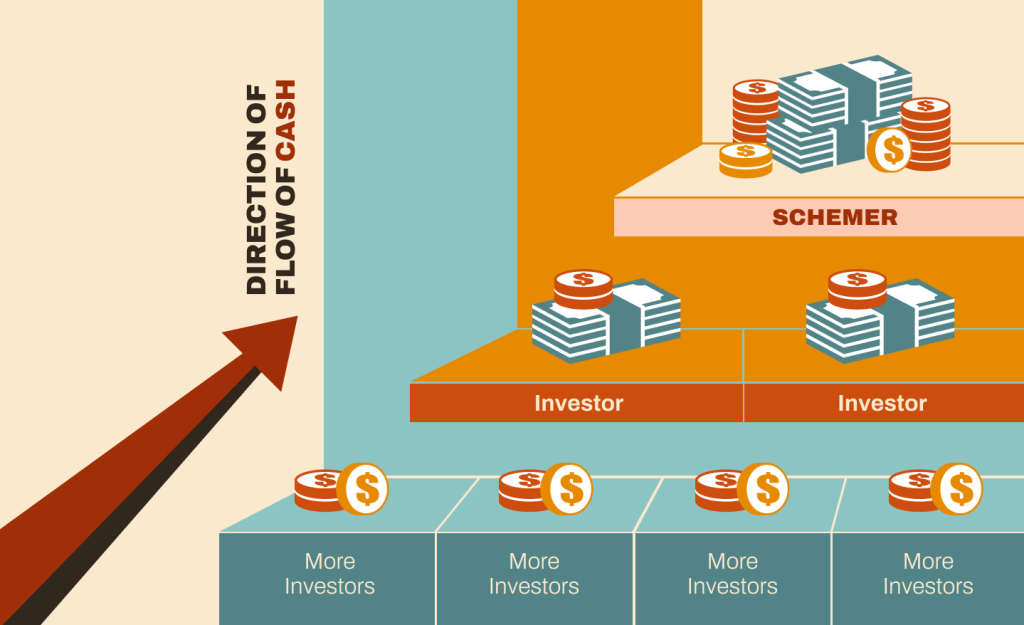
No worries if it doesn’t. Just imagine the pyramid or ponzi figure above as a family tree at the national level. We have “More Babies” instead of “More Investors”, and “Me” and “You” instead of “Investor” and “Parents/Grandparents” instead of “Schemer”. Just to clarify, there is absolutely and unequivocally no comparison between our birth parents and schemers. Taking away “More Investors” from the equation has the same effect as taking away “More Babies”. As we will see later using the US as an example, fiscal revenue sustainability depends heavily on personal income taxes, which in turn is derived from a working and economically active population. We hypothesize, that removing “More babies” reduces the inflow into the population pyramid, thereby reducing the size of the economically active population, hence triggering a drop in fiscal revenue, all other things being equal. There is no other country as big an immigration magnet as the US, and with abundant data available, we look to the US for guidance on our hypothesis. But let’s first understand how taxation works there.
The Taxation System
Death and taxes. All countries rely on some form of taxation one way or another for fiscal revenue. Taxes can be levied on several components such as income, sales, capital gains etc. In each country, the extent of reliance on each component differs according to the different policies, hence the origination of the term tax haven. For the US, the tax revenue base sits squarely on taxable income, profits and capital gains, and of which individual income tax is the greatest contributor.
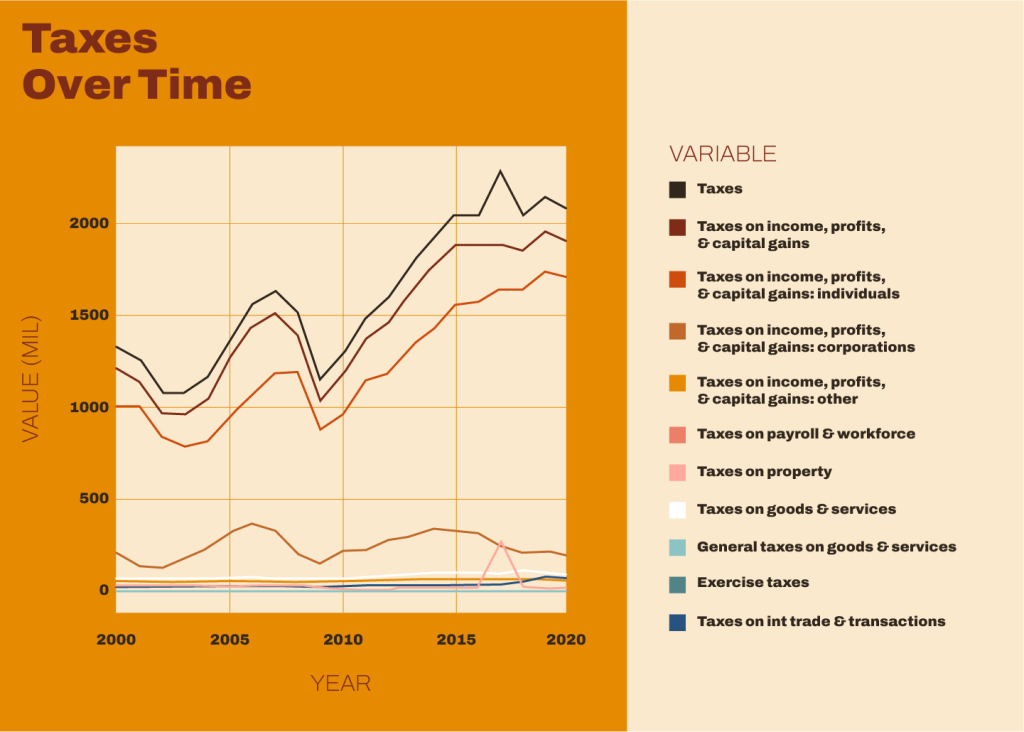
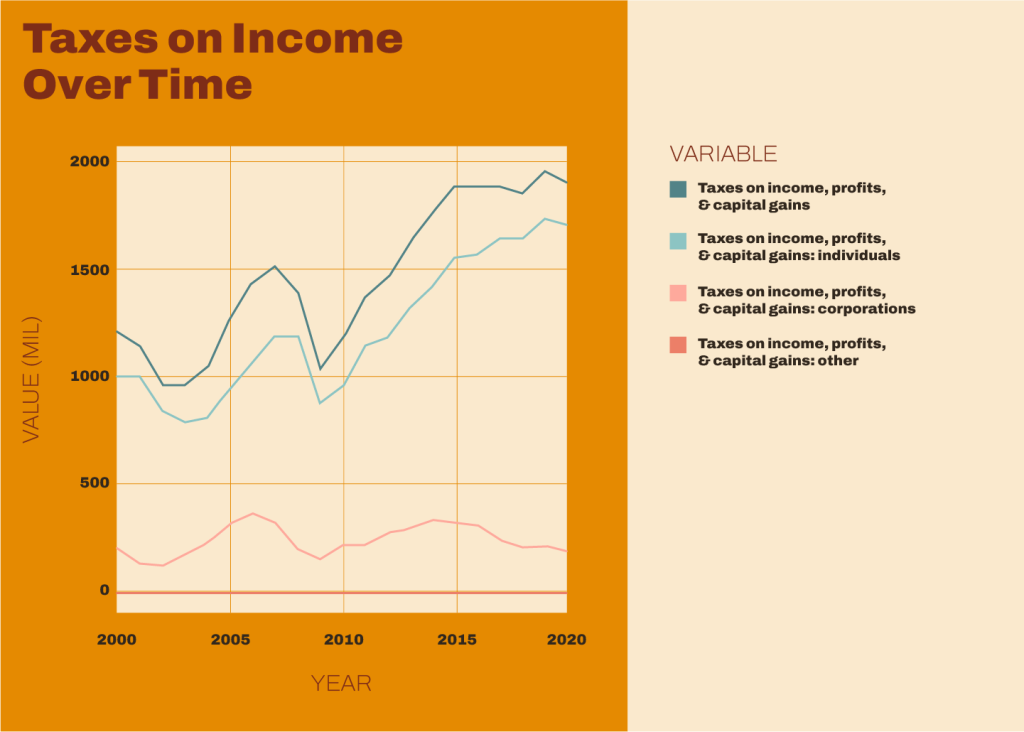
Based on the figure 1, tax revenues were generally on an uptrend from 2000 to 2020 with only 2 troughs – the 2001 bursting of the dotcom bubble and the 2008 GFC, as well as more recently – Covid in 2020. The fluctuations were most pronounced in individual income tax. The fact that individual income tax forms such a key component of tax revenue demonstrates the importance of an economically active population and the labour participation rate. Which brings us to the next question: Does the demographics of a population play any role in maintaining the sustainability of the government’s taxation system?
Population Demographics of the United States of America
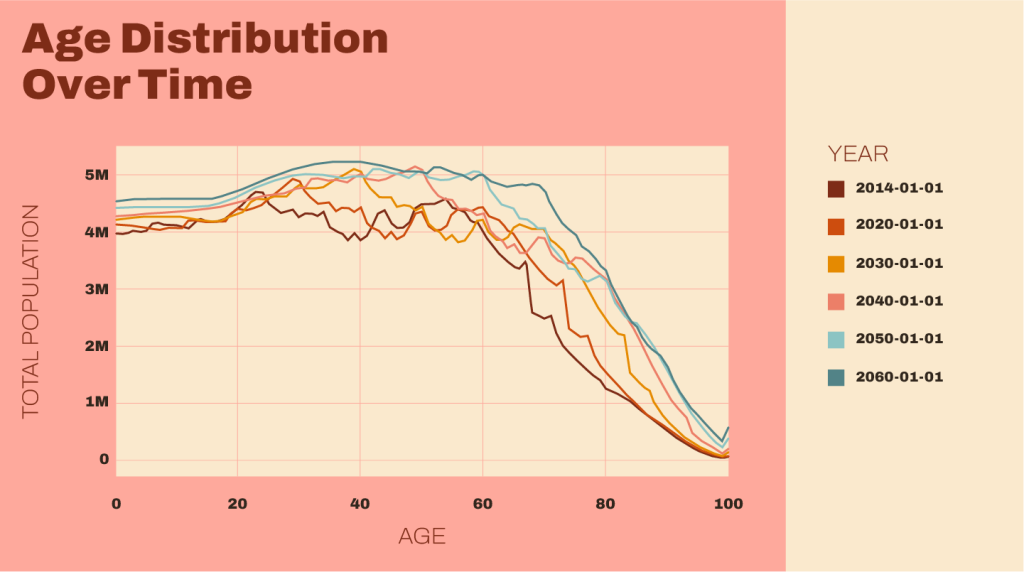
In Figure 4 above, we have the national population projections released by the United States Census Bureau in 2014.
A brief explanation on how the graph is interpreted. The x-axis represents the age; the y-axis represents the population; each curve represents a particular year. Taking the point (20, 4.6M) on the 2050 curve as an example, it means that in that year, there are projected to be approximately 4.6 million people at the age of 20.
From the graph, we observe the peaks of each curve gradually shifting right over time. This implies stagnating or slowing population growth as well as an ageing population segment. The absence of new and earlier age peaks indicate a peak in population growth that has not been surpassed. For example, in 2020, the age group with the largest population was approximately 29. In 2030, this same population remains the largest, albeit older at age 39. So, what can we imply from this? Two key observations: (1) the shoes look unlikely to be filled – the largest economically active population group is expected to exit the workforce by 2060, with no follow on wave; and (2) this same population group will form the largest aged population by then.
Death and Taxes
With declining birth rates AND declining mortality rates will we see a double whammy of a drop in fiscal revenue and a spike in fiscal spending? An ageing population not only spells lower tax revenue, but also increased healthcare and infrastructure spending.
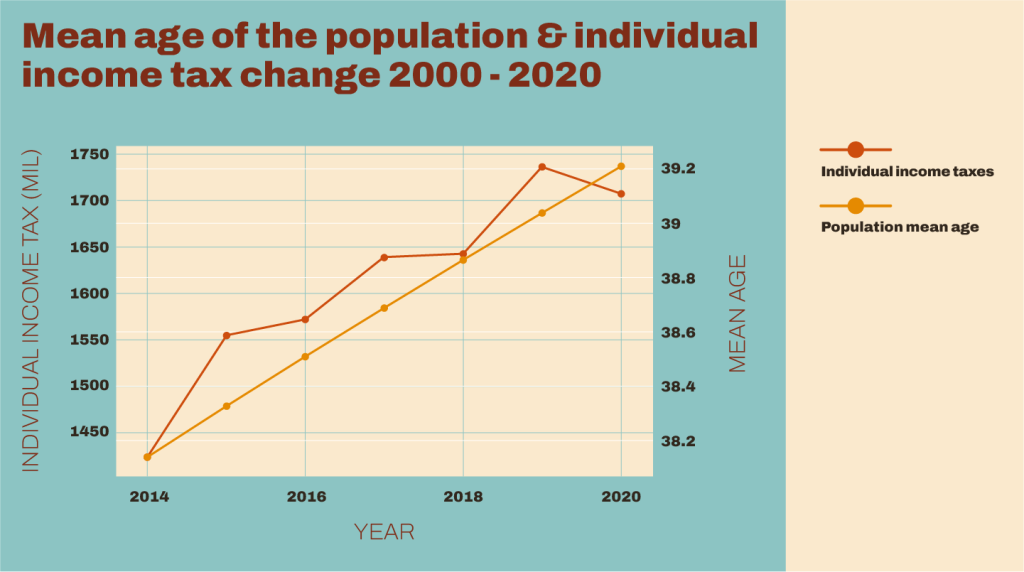
For now, the numbers tell a different story, or maybe we’re just not there yet. Even as the mean age increases, individual income tax revenue shows no sign of any decline, again except for 2020, which tells us instead of the economic risk from a decline of an economically active population – whether by mortality or by income inactivity. Perversely more obvious, has been the (increasing) wealth effect on individual income tax revenue.
Disclaimer
Please refer to our terms and conditions for the full disclaimer for Stoic Capital Pte Limited (“Stoic Capital”). No part of this article can be reproduced, redistributed, in any form, whether in whole or part for any purpose without the prior consent of Stoic Capital. The views expressed here reflect the personal views of the staff of Stoic Capital. This article is published strictly for general information and consumption only and not to be regarded as research nor does it constitute an offer, an invitation to offer, a solicitation or a recommendation, financial and/or investment advice of any nature whatsoever by Stoic Capital. Whilst Stoic Capital has taken care to ensure that the information contained therein is complete and accurate, this article is provided on an “as is” basis and using Stoic Capital’s own rates, calculations and methodology. No warranty is given and no liability is accepted by Stoic Capital, its directors and officers for any loss arising directly or indirectly as a result of your acting or relying on any information in this update. This publication is not directed to, or intended for distribution to or use by, any person or entity who is a citizen or resident of or located in any locality, state, country or other jurisdiction where such distribution, publication, availability or use would be contrary to law or regulation.