How are we approaching the US Debt Ceiling?


Zhen Hao


What is the US debt ceiling?
The US debt ceiling, is essentially the maximum amount of dollars the US government can borrow for its expenses such as in military expense, Medicare and Social Security.
In January, 2023, the debt ceiling level is at $31.4 trillion. Unsurprisingly, the total national debt was also at $31.4 trillion as seen in Figure 1.
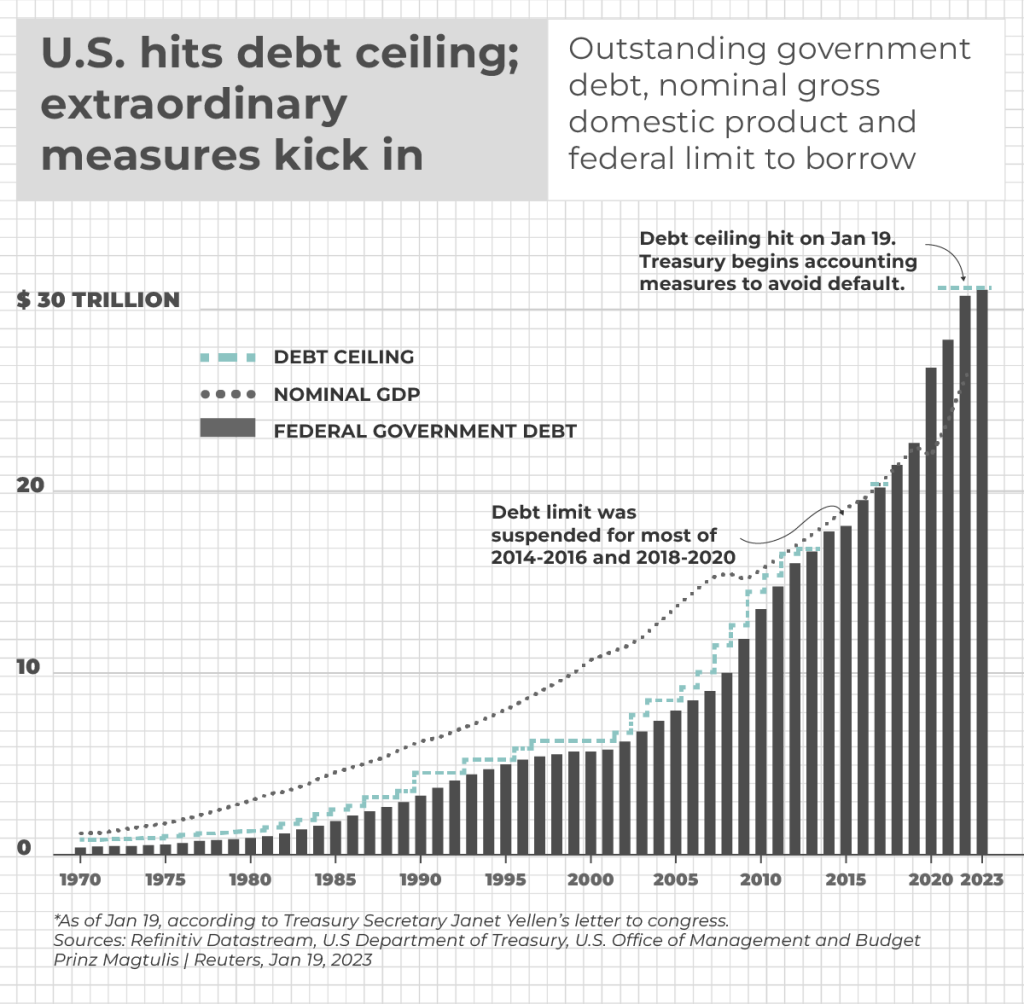
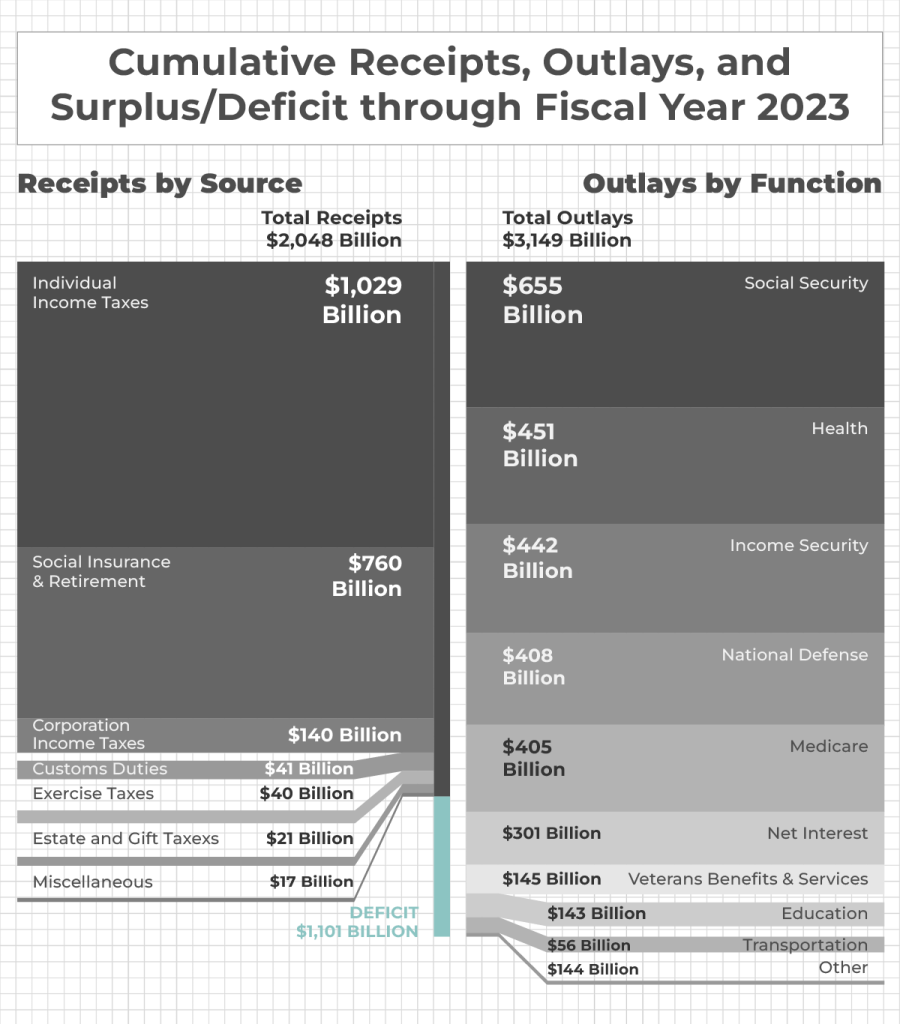
The federal government has spent $1.1 trillion more than it has collected in fiscal year 2023. The government has to borrow in order to finance the various expenses that the government is involved in. This increase in borrowing is what increases the US national debt level, and as recent as January 2023, the national debt level has matched the debt ceiling and it is still on the rise as we speak.
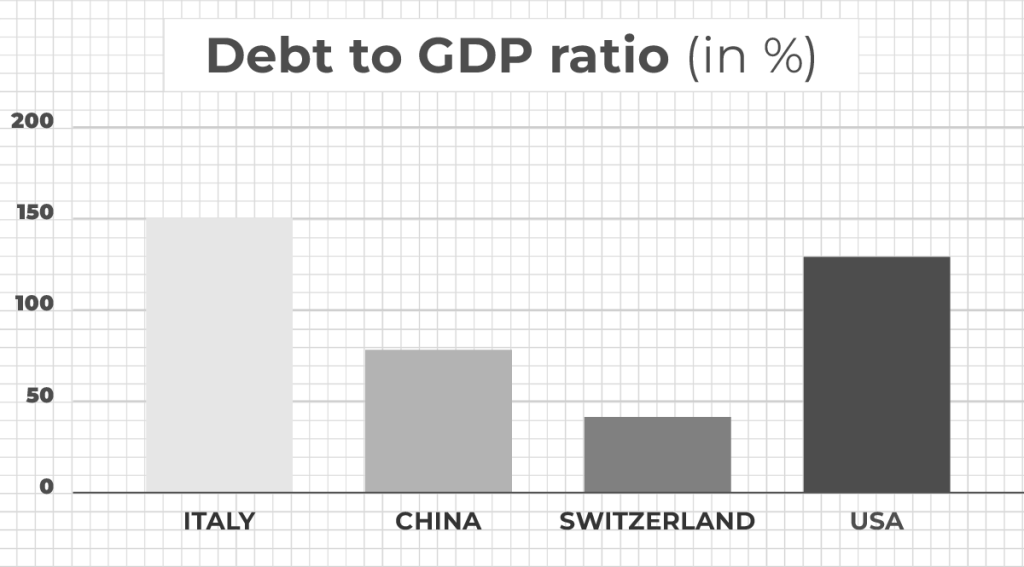
The US debt to GDP ratio is at 129%. For comparison, Switzerland’s ratio is 41%, China’s ratio is 77% and Italy’s ratio is 151% as shown below in Figure 2. With a relatively high debt to GDP ratio, the US is not in an ideal position as this shows that the debt level is very high relative to other nations suggesting a higher chance of default.
Proportion of US debt by the Fed and the public
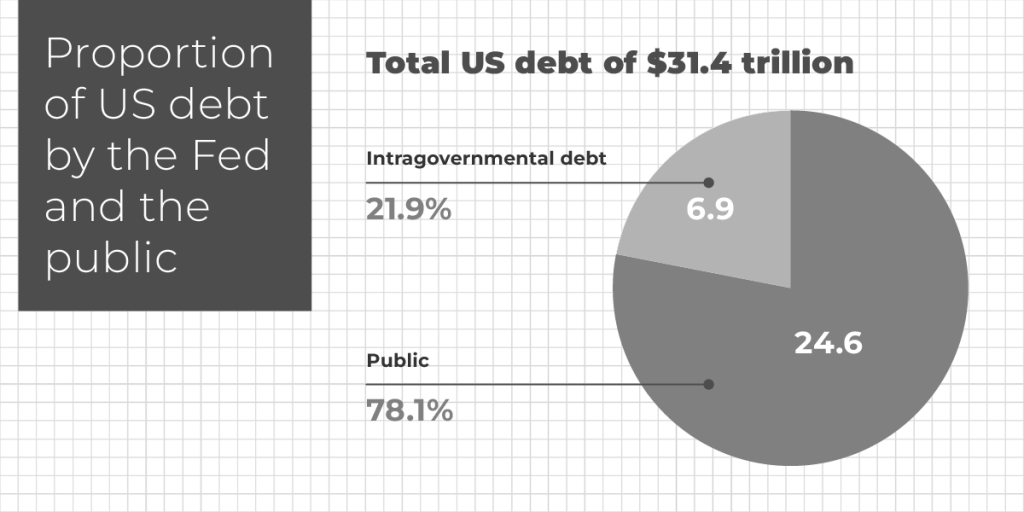
As illustrated above in Figure 3, of the $31.4 trillion debt, about 78% or $24.6 trillion is owned by the mass public while the remaining 22% or $ 6.9 trillion is intragovernmental debt. Since a massive 78% of debt is owned by the public, the US government must pay a hefty amount of interest expense estimated to be around close to $500 billion. This amount alone is already greater than the TGA balance value. This is one of several expenses that the government has to pay and with increasing expenses and even interest payments costing so much, the government’s budget would surely take a hit. Additionally, with the rise in interest rates, there would be a significant increase in interest payment to debt holders. In particular, the public is projected to receive about $400 billion in interest payment since around 80% of debt is owned by the public.
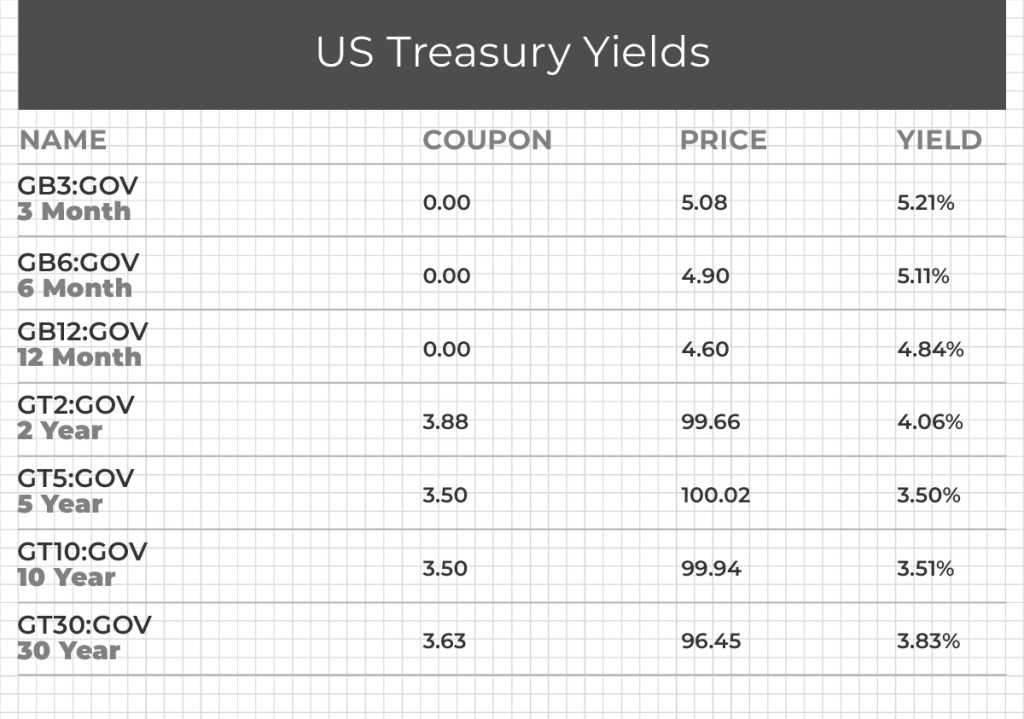
We can also see above in Figure 4 that the yields for short term Treasury bonds is about 5%. With short-term T-bills’ yields upwards of 5%, interest payment would also likely rise very quickly.
History of the US debt ceiling
Established in 1917, the purpose of the debt ceiling is to cap the level of sovereign borrowing to the stipulated level and not let it go above the ceiling. Since 1960, there has been a total of 78 times the debt ceiling is either raised or extended.
To raise the debt ceiling would be to permanently increase the current limit as to how much the government can borrow. An example is in 2011, where the US President Barack Obama in 2011 signed a bill to raise the debt ceiling, therefore allowing the nation’s $14.3 trillion borrowing limit to increase by up to $2.4 trillion.
To extend would be to give a temporary suspension or delay of the current debt limit, it does not change the actual limit of borrowings by the government. An example of a suspension of the debt would be in 2019, where the debt ceiling was suspended under President Donald Trump.
Where does the US Fed get its cash from?
Firstly, the Fed holds a lot of government securities, such as US Treasury bonds. The interest earned from these assets provides revenue for the Fed.
Secondly, the Fed lends money to commercial banks and other depository institutions. The interest earned from these loans gives the Fed interest revenue.
Thirdly, the Fed also would earn operational income through open market operations involving the purchase and sale of government securities in the open market.
Fourthly, the Fed earns money from exchanging foreign currency with other central banks.
What is the Treasury General Account and how does it relate to the debt ceiling?
The US Treasury General Account (TGA) is a financial account held by the US Treasury to manage the government’s cash balance and to process all receipts and payments by the US Federal Reserve. Receipts include the various taxes collected such as income tax and payroll taxes and also the proceeds from sales of any US government bonds. Payments include Social Security and Medicare payments, government employee salaries and interest payments on US debt instruments held by foreign investors as shown in Figure 5. The net difference between receipt and payment would be the value of the US TGA. The TGA is crucial in terms of determining the health of the US Federal Reserve’s financial health and also is of paramount importance in maintaining the stability of the US economy.
As mentioned at the start of the article, the US national debt level is at equilibrium with the US debt ceiling. When the US government reaches the limit of borrowing, it cannot issue new bonds. Thus, the government now has insufficient cash on hand to meet their expense needs. In this unique situation, the US Treasury can tap on the TGA to aid in covering the expenses. However, it is important to note that the TGA may not have sufficient funds to cover the outstanding debt.
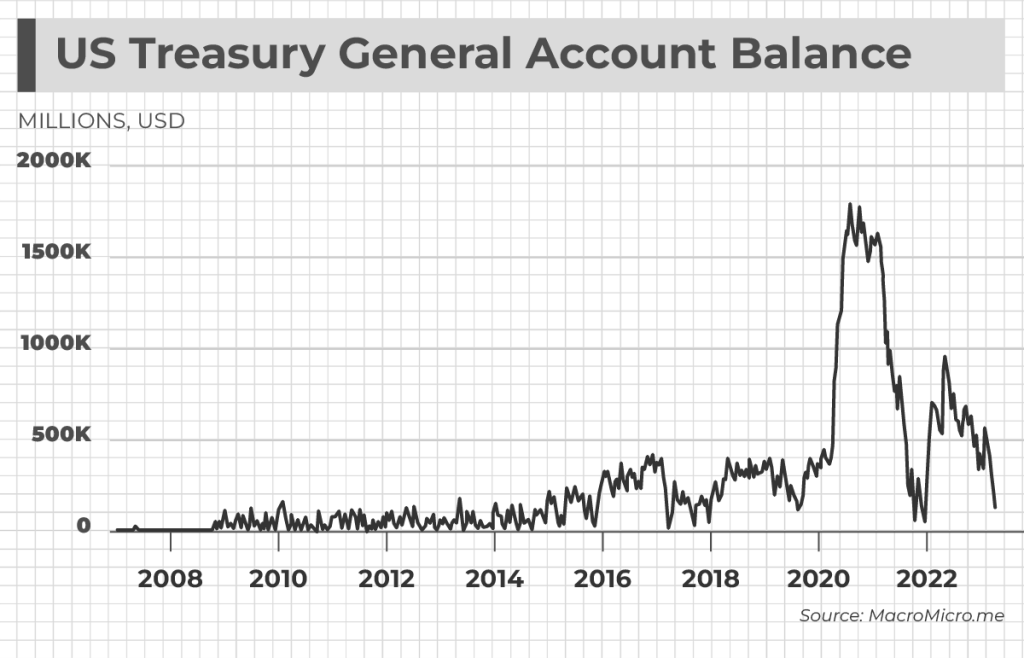
Looking above at the graph at Figure 6, in 2020, the Treasury piled up lots of cash to prepare for the projected $1 trillion pandemic relief package. But the money was not used until December 2021 as the stimulus was not yet passed. Over the past year, the TGA balance has dropped steadily to about $50 billion by the end of May 2023. One possible reason is that the US Treasury has tapped on the TGA to help with the outstanding debt. It is obvious that the massive decrease in the TGA from $1.6 trillion at the start of 2021 to about $50 billion by the end of May 2023 shows that the health of the US economy is deteriorating rapidly due to the high levels of sovereign expenditure.
Composition of the TGA in the US government’s balance sheet
The TGA balance in the balance sheet of the US government appears as a liability for the US government. During the pandemic, the Fed bought almost $6 trillion of Treasury bonds and mortgage backed securities. This will then appear as an asset in the Fed’s balance sheet while appearing as a liability in the government’s balance sheet. We can also see that the TGA value has increased from $557 billion to $662 billion, possibly because the Fed has purchased Treasury securities. Since close to 80% of US debt is owned by the general public, about 80% of interest payments would be made to the general public. Adding on to the amount of interest to be paid is the higher interest rates which would further increase the interest payment and add on to the financial burden of the US government. The value of interest payment made to the general public is estimated to be close to $400 billion since the total interest expense is estimated to be close to $500 billion for this year.
Evolution of TGA inflow and outflow over time
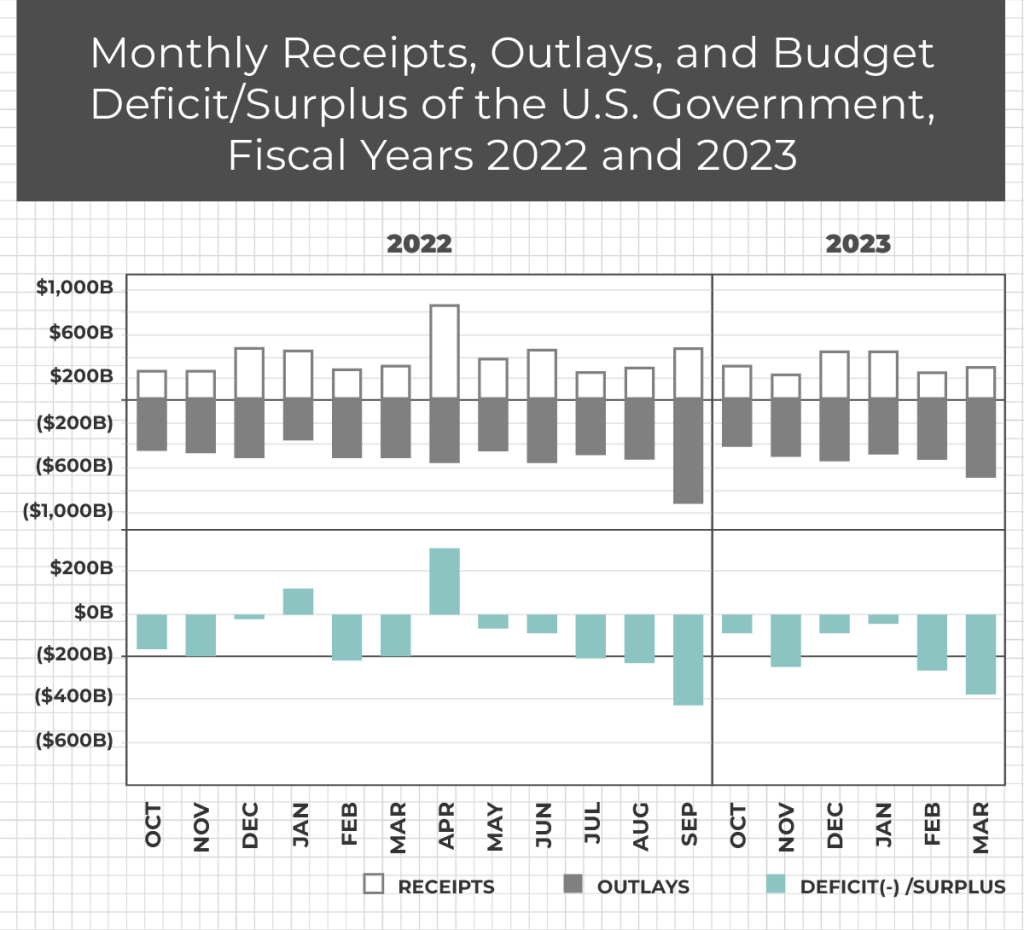
We can see above in Figure 7 that the US is running on a deficit almost all the time since October 2022 and the government has been tapping on the TGA to cover some of the expense. The receipts have almost always been lower than the outlays as shown above. Thus coming to a cumulative deficit of $1.1 trillion last Fiscal Year 2023. This consistent deficit has led the US government to keep borrowing in order to sustain their expenses, which is why the national debt level is always increasing and thus the debt ceiling also has to be increased.
How was the US FED involved in the debt ceiling?
Remember the 2008 Global Financial Crisis that caused investment bank Lehman Brothers to collapse and more than $2 trillion of economic growth to evaporate? Because of the financial Armageddon that the Global Financial Crisis caused, the Congress had to raise the debt ceiling from $10.6 trillion to $14.3 trillion shown below in Figure 8 as the government had to keep borrowing money.
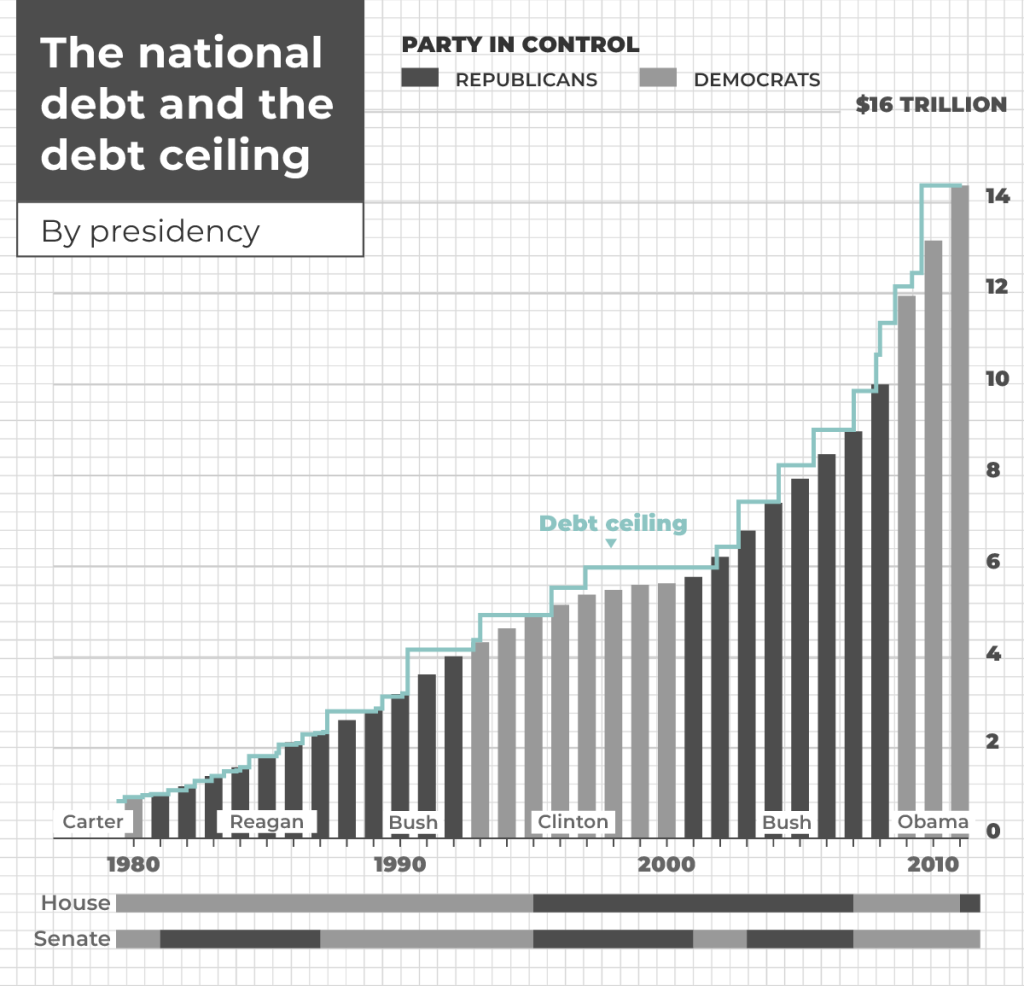
Going into 2011, the economy started to show signs of recovery and hence the US debt started to creep towards the debt limit. Negotiations began in the Congress to try to resolve the issue between spending and the hefty debt level. The US Fed bought an additional $600 billion in long-term Treasury bonds by end June, 2011. The increase in demand for US Treasury bonds helps the government to finance debt at a lower rate. This is because the increase in demand leads to higher bond prices which in turn drives yields down. So these sovereign bonds can then be purchased at a cheaper rate, allowing the government to finance debt at a lower interest rate despite the constraints inflicted by the debt ceiling. On the contrary, if the US Fed did not purchase the Treasury bonds, then demand for these debts would be lower, resulting in higher yields, making it even more costly for the government to borrow money, making the national debt burden even more arduous to manage.
However, in spite of the US Fed’s aid, Standard & Poor’s rating agency still downgraded the US long-term credit rating from AAA to AA+ because of the uncertainty and political instability of the US. During this debt crisis, the Republicans in Congress demanded cuts in spending for their support in raising the debt ceiling, without any tax increases. Whereas, the Democrats and then President, Barack Obama, were pushing for tax reforms which would increase revenue for the government. The dichotomy in views between the Republicans and the Democrats was what caused a stir and made this debt ceiling issue unresolved until days before what would have been a catastrophic financial crisis.
How closely linked are the Fed and the Treasury?
The Fed is the central bank of the US and primarily controls monetary policies to keep check on inflation, growth and unemployment. Whereas, the Treasury is a department in the US government that manages the Fed’s finances and also involved in issuing government securities like the US10Y. However, both organizations work very closely to support one another.
The way in which the Fed and the Treasury are intertwined is through the TGA. As mentioned, the TGA is the financial account held by the Treasury that processes all financial transactions the Fed is involved in. For example, when the Fed decides to spend money, the Treasury will withdraw money from the TGA.
Another way where they work together is in the matter of Treasury bonds. The Treasury issues bonds in order to finance the government’s expenses. The Fed can then impact the demand for these Treasury bonds with monetary policies by changing the interest rates, which affects the cost of borrowing.
Finally, both institutions work closely in tandem to ensure financial stability around the globe, especially in times of financial instability as we are in right now. They coordinate their policies well in order to achieve the desired outcome as established by the Fed.
What about the stimulus checks?
Stimulus checks are financial payments by the US Treasury to taxpayers. The US Treasury collaborated with the Congress to pass legislation for the authorization of the checks and also provided the relevant funds to pay for these checks. The objective of these checks is to help Americans tide over difficult times just as we have seen in the Covid-19 pandemic. In 2020, a total of $814 billion was distributed as cash payments to fellow Americans. This dwarfs the payments in 2008, where a total of $152 billion was given out as Economic Stimulus payment.
| Year | 2020 CARES Act Stimulus | 2008 Bush Economic Stimulus |
|---|---|---|
| Individual taxpayer received | ≤ $1.2k | ≤$0.6k |
| Married couples received | ≤ $2.4k | ≤ $1.2k |
| Household with children received | ≤ $500/child | ≤ $300/child |
| Total amount of stimulus payment | $814 billion | $152 billion |
We can see in Figure 9 that with so much money being taken out of the US Treasury, the TGA is likely to take a hit. The US government is involved with several other expenses that are similar in magnitude like the Medicare expense at $776 billion in 2020.
Where does the FDIC get its cash from?
The Federal Deposit Insurance Corporation (FDIC) was created by the US government to provide insurance to depositors in case the bank collapses.
Firstly, the FDIC receives insurance premiums from banks and other financial institutions. The consideration for the banks would be getting deposit insurance coverage from the FDIC.
Secondly, the FDIC has holdings in safe US government bonds and they get interest income from that.
How are the bank failures and FDIC relevant?
The FDIC helps with bank runs by providing insurance to protect depositors in case the bank collapses. When a bank is protected by the FDIC, every depositor is insured up to $250,000. The FDIC does not receive any Congressional financial support and is only funded by premiums that banks pay to them. When a bank run does occur and many depositors try to withdraw their money, the FDIC would come in and ensure that all depositor’s money is safe. When a bank does fail, the FDIC will then pay out the deposits to clients of the bank and take over the bank.
In the recent bank collapse of Silicon Valley Bank as well as Signature Bank, the FDIC has stepped in to ensure that all deposit accounts in both institutions would be guaranteed by the FDIC. Signature bank and Silicon Valley Bank were both FDIC-insured, so $89 billion and $175 billion in deposits respectively were insured by the FDIC.
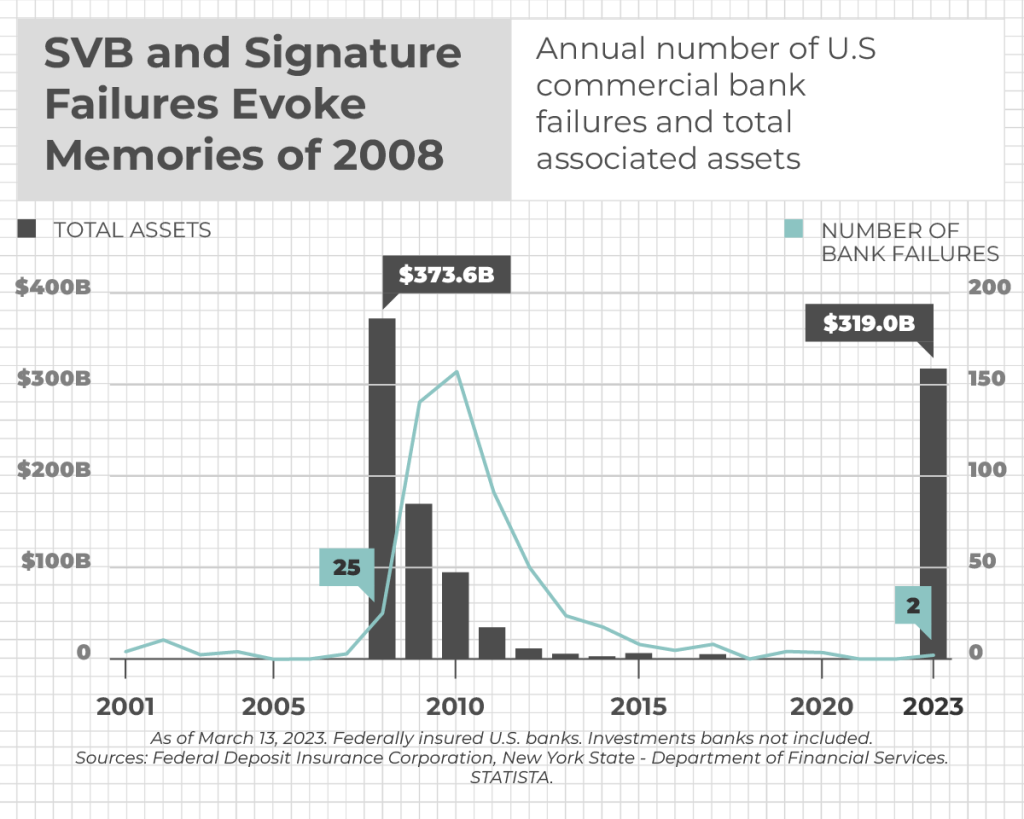
Figure 10 above shows the total asset value for both banks that collapsed is about $319 billion.
The FDIC would use funds from the Depositor Insurance Fund to ensure that depositors are fully paid. As mentioned previously as well, the FDIC would take cash from banks and pool them all together in order to fund the deposit insurances when banks collapse.
Credit Default Swap’s role in predicting a potential default
A Credit Default Swap (CDS) is a financial derivative that allows investors to transfer the risk of a debt instrument to another investor, essentially, it is like a insurance against the risk of defaulting.
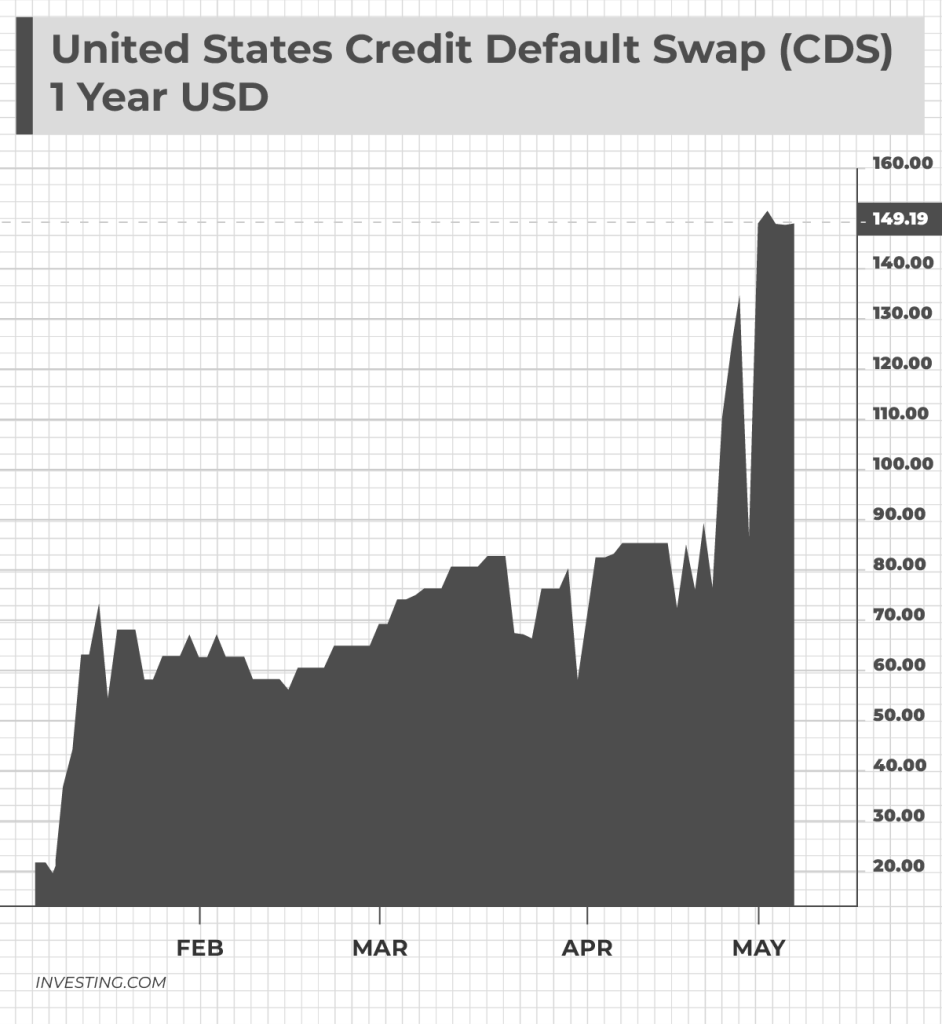
The US CDS 1Y is trading at all time high of $151 in May 2023 as shown in Figure 11, increasing dramatically since Janet Yellen warned the Congress in early January 2023. The higher CDS value means it costs more to insure against the risk of default, suggesting to us that the market believes that the chance of a default is very high.
Biden threatens to invoke the 14th Amendment
The 14th Amendment to the US Constitution was formalized in 1868 to eliminate slavery and ensure human rights for Black Americans. What we are interested in specifically, is the 4th section of the Amendment. It states ‘The validity of the public debt of the United States, authorized by law, including debts incurred for payment of pensions and bounties for services in suppressing insurrection or rebellion, shall not be questioned.’ This presents to Biden a legal instrument to circumvent the debt ceiling issue. How then does it work?
In the unfortunate case where the Congress fails to act on the debt ceiling, President Biden could invoke the 14th Amendment. With the utilization of this legal instrument, the US can continue borrowing to pay its obligations and simply ignore the debt ceiling without having to raise nor suspend it.
However, if Biden uses the 14th Amendment before the default date, he would most likely be sued by various parties and the Amendment might not come into effect at all in this case.
How is the 2023 debt ceiling issue similar to that in 2011?
In 2011, then US Treasury Secretary Timothy Geithner sent a formal letter in February 2011 to warn about the potential debt ceiling crisis in May 2011. He also projected that the debt ceiling would be reached very soon at that time. Now in 2023, Janet Yellen has also raised similar concerns about the debt ceiling being reached very soon and on the disastrous consequence if nothing is done. In 2011, the US had a Democratic President in Barack Obama. In 2023, Joe Biden is also a Democrat. In 2011, the Republicans were pushing for spending cuts. Similarly, the 2023 Republicans are also fighting for spending cuts and raising the ceiling.
What the issue is right now is that while the Republicans want to raise the debt ceiling, they also want a large spending cut to lessen the annual budget deficit that is a result of the Covid-19 relief payments to help Americans tide over the tough times. On the contrary, what Joe Biden and the Democrats are pushing for is that they want the debt ceiling raised with no other conditions such as reducing spending. Joe Biden has also been very firm in his opinion and would unlikely want to negotiate with the Republicans.
The silver lining
The exact date of a US default is known as the ‘X date’. It is not going to be easy to exactly determine the date where the US would potentially default due to the complex nature of receipts and payments. But as Janet Yellen has said, it could precariously be as near as 1st June 2023. The Congress must either raise or suspend the debt ceiling in order to avert the crisis. However, with politics being increasingly polarizing, an amicable resolution might be an arduous thing to ask for.
Throughout history, the US government has hit the debt ceiling many times and we do not foresee this time to be the last.
Even though political tensions are very high and that a dispute resolution on raising the debt ceiling issue seems unlikely during the week where Biden, the Senate and the House meet, we are of the opinion that the US would still either raise or suspend the debt ceiling just before the deadline in order to prevent a financial Armageddon from happening.
Disclaimer
Please refer to our terms and conditions for the full disclaimer for Stoic Capital Pte Limited (“Stoic Capital”). No part of this article can be reproduced, redistributed, in any form, whether in whole or part for any purpose without the prior consent of Stoic Capital. The views expressed here reflect the personal views of the staff of Stoic Capital. This article is published strictly for general information and consumption only and not to be regarded as research nor does it constitute an offer, an invitation to offer, a solicitation or a recommendation, financial and/or investment advice of any nature whatsoever by Stoic Capital. Whilst Stoic Capital has taken care to ensure that the information contained therein is complete and accurate, this article is provided on an “as is” basis and using Stoic Capital’s own rates, calculations and methodology. No warranty is given and no liability is accepted by Stoic Capital, its directors and officers for any loss arising directly or indirectly as a result of your acting or relying on any information in this update. This publication is not directed to, or intended for distribution to or use by, any person or entity who is a citizen or resident of or located in any locality, state, country or other jurisdiction where such distribution, publication, availability or use would be contrary to law or regulation.