The Domino Effect of US Interest Rate Hikes

Caleb Mah
What’s Going On?
Everything. And all at the same time. Maybe this time it’s different? We’re leaning towards this time it’s different and new mistakes will be made but followed by a nasty dose of deja vu.
The market has just about priced in a 250-275bps rate hike by the end of the year. Yield curves are flashing recession signals, inflation numbers at all time highs across the globe, and Russia is teetering on the warfront with a war crimes tribunal close behind. Yet both the ruble and the Moex have recovered with Putin’s approval ratings allegedly performing just as well.
While the war in Ukraine isn’t completely behind the spike in inflation numbers, and notwithstanding that Fed hikes arguably aren’t a direct cure for commodities-supply driven inflation, the Fed has shown resolve to hike whatever is takes to tame inflation.
The inevitability of an increase in borrowing costs for homeowners, consumers and businesses (probably in that order) looks very much like an iceberg. The link between interest rates and fixed income is clear and undisputable, but somewhat more tenuous for commodities and equities. But that has always been the challenge with monetary policy and action movies – quick to cut, slow to bleed. Or maybe like an Oscars slap.
Everybody seems to know exactly what’s coming. For commodities, we’re more staunch believers in the supply and demand numbers. But for equities, it’s worth taking a quick glance down memory lane.
The Domino Effect of Interest Rates
The response lag of monetary policy can range drastically from 29 months in developed economies to about 10 months in post-transition economies. However, for asset prices, this lag is much smaller. In an empirical study conducted by the ECB, asset prices can react to monetary policy shocks in as quickly as 4 months.
Interest Rates and Stocks
Interest rates are the prime determinant of borrowing costs for businesses amongst credit factors. And morbidly, interest rate increases are to businesses what boiling water is to frogs. The earnings or income squeeze on unhedged and/or highly leveraged borrowers lie clearly in sight on the horizon, with little alternatives especially with the assumed ferocity of hikes this year. The topline squeeze pressures companies to tamper (commodities) procurement ahead of weakened demand and dampens stock prices with the impact trickling down to employees and consumers. With this endgame in mind, the expectation of hikes alone is enough to precipitate investor panic, exacerbated by heightened volatility. We’ve already seen the swings ahead of the March hike as pre-emption began, how easy the coming few rounds ahead will be is anyone’s guess.
Different Era Maybe
Capital markets seemed to have changed over the years. Capital availability has broadened beyond the remit of the traditional financial intermediaries – increased securitisation of fixed income, crowdfunding, peer lending, crypto and the likes. So perhaps it is different this time. But it’s hard for us to comment without delving deeper into this space. What we have seen are the first signs of an impact in the commodities space – liquidity declining in the derivatives space, behemoth commodities traders seeking financing lines, and managing working capital can’t be easy if you’re a farmer with a thousand acres to manage. We even half suspect, the dramatic shift in acreage to beans a week back, was driven by working capital considerations given where fertiliser prices are and the ongoing squeezes in labour and input supply chains. With such a pervasive impact in the real economy, how much time exactly do we have ahead of the proverbial iceberg for equities.
Data
If you’re still with us at this juncture, we’d just like to state for the record none of this is research or solicitation of any kind, just ramblings out aloud as we explore history. Comparatively, the complexities and myriad of considerations when dealing with trading and investment decisions pale against the complications of interpersonal relationships. But there are some predictable patterns when observing the behaviour of masses of individuals manifesting in asset prices.
Graphical Analyses
To better observe the lagged impact of an interest rate hike, graphs are plotted inclusive of two years before and after each hike.
Overall Trend
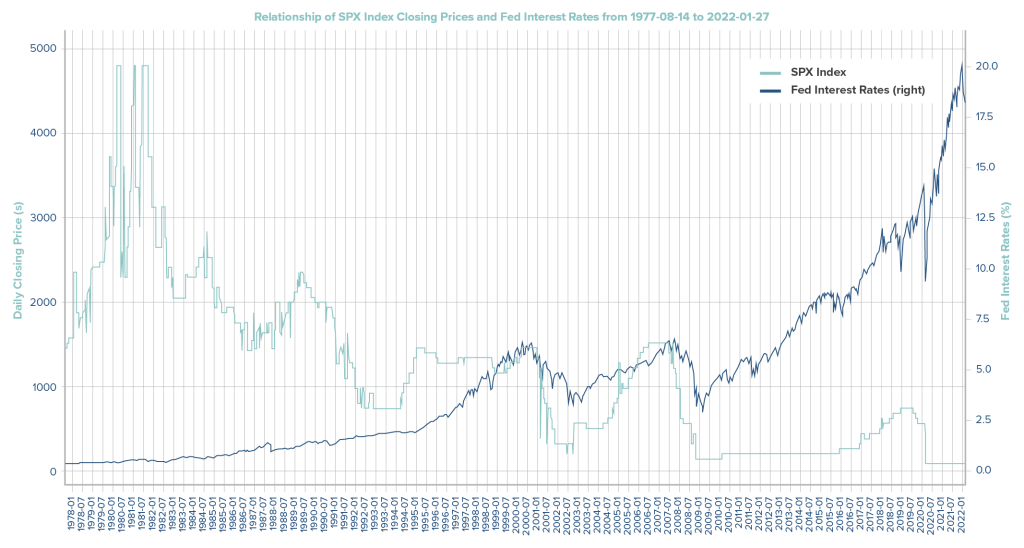
We start our analysis by a superficial glance of SPX price trends plotted against interest rates. Broadly speaking, we see that interest rates act almost like resistance levels for prices for past periods and support levels for present periods. This idea is highly evidenced in periods from 1997 to 2008, where the peak of each rate hike cycle coincided with the peaks of SPX. Anecdotally, this reasons well with the belief that monetary policy effects lag by 6 months or more. The absolute levels of the rate hike cycle peaks relative to the beginning of the rate hike cycle appears to play a significant role as well in triggering the eventual decline in asset prices.
The Fed Interest Rate Hike of 1977-1980

Ironically, there is some resemblance now to the post oil crisis era when Volcker served as Fed Chairman. Following the oil crises around 1973 and 1979, similar theories and critique were put forth on peak oil and overreliance on imported oil. The oil embargo emplaced on the US following the Yom Kippur war and subsequent destablisation occurring within Iran led to inflation rates rocketing. While the Fed’s perhaps equally aggressive monetary policies was credited with reducing inflation rates, it also set the stage for unemployment and arguably one of worst crashes in equities albeit years later. This subsequently led to much political backlash from individuals working in construction and agriculture.
When zoomed into a short run perspective, lagged responsiveness becomes easier to spot (if you buy the economics convention the inverse relationship between interest rates and asset prices). In early 1980 when interest rates hit their peak of 20%, SPX prices continued climbing all the way until the middle of 1981. Of course, it’s impossible to ascertain if interest rates were the prime contributor of this from the graphs alone. An interesting observation nonetheless.
The Fed Interest Rate Hike of 2004-2006
With the passage of time, along with inflation targeting came with each Fed chair his or her own unique evolutionary path – e.g. the Greenspan/Bernanke Put, Goldilocks. Inflation rates of the 1970s-1980s became a thing of the past and its place came a much more moderated approach in addressing in inflation. To hike in enough moderation to curb inflation without triggering a recession became the motto. It’s hard to tell the difference nowadays, though everyone says it’s always different this time.
Price movements in this period look eerily similar today. While the rate hikes plateaued in 2006-7, the commodities supercycle was already well under way. Some of our ex-colleagues endearingly described the period as the year of the “1s” – $100 oil, $10 wheat, and at one point almost $10k copper. Hardly surprising, given that low interest rates – low inflationary environments are often more than supportive for risk assets, and vice versa for high interest rates – inflationary environments. And then came the Great Recession or the Great Financial Crisis and the Great Bailout. The question now, as it has been for decades, now boils down to timing. As bearish sentiment mounts now, as can be seen from the prevalence of crash predictions on twitter, the question of the mother of all crashes has become one of “when” rather than “whether”.

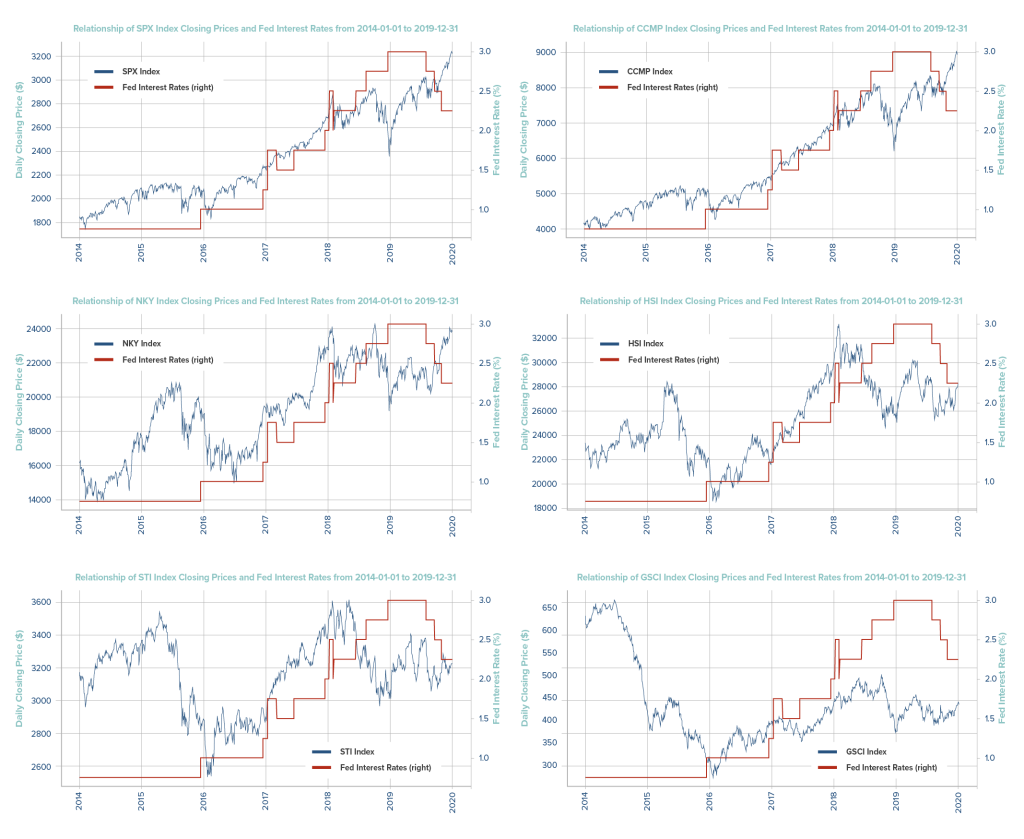
The Fed Interest Rate Hike of 2016-2018
Moderation. The commodities supercycle of 2005-7 gave birth to the great commodities behemoths in the decade that followed. Again, (no) coincidence now that many are drawing parallels between the great bailout of banks in 2008 to ensure the functioning of the financial economy and to prevent spillover into the real economy (with real people) vs the emergency liquidity funding now for the same commodities behemoths that thrived in the decade before to ensure the the continued flow of (real) goods/commodities across oceans and borders.
Nonetheless, this window of time stands as particularly curious for equities at least. Interest rates and SPX/CCMP prices climbed in lockstep from 2016 all the way to late 2018, when prices start falling to their lows in that specific timeframe. As the world has become more interconnected in terms of imports and exports, we start seeing trickle down effects of Fed interest rates on HSI and STI. A more or less inverse relationship is demonstrated.
The only sector to have decouple during this period – commodities. Sure, we all know the complications with commodities indices – negative/positive roll yields, the fight between seaborne Brent and landlocked WTI for representation, explosion in US shale crude production etc. Even then, GSCI seems to be in its own world in regards to price trends. Its decline from 2014 to 2015 was counterintuitive. Here in Asia, the collapse in crude prices led to the demise of not just the O&G players, but also the oil services and shipping players.
Conclusion
The next move as an investor or a trader is critical. Divergence in performance across the sectors is what we think. And while the crash that everyone is talking seems inevitable, it’s anybody’s guess as to when that would come exactly. History seems to give some clues as to the timing of this, but waiting or shorting could still prove costly in this seemingly irrational market – even for those who have limitless liquidity.
Disclaimer
Please refer to our terms and conditions for the full disclaimer for Stoic Capital Pte Limited (“Stoic Capital”). No part of this article can be reproduced, redistributed, in any form, whether in whole or part for any purpose without the prior consent of Stoic Capital. The views expressed here reflect the personal views of the staff of Stoic Capital. This article is published strictly for general information and consumption only and not to be regarded as research nor does it constitute an offer, an invitation to offer, a solicitation or a recommendation, financial and/or investment advice of any nature whatsoever by Stoic Capital. Whilst Stoic Capital has taken care to ensure that the information contained therein is complete and accurate, this article is provided on an “as is” basis and using Stoic Capital’s own rates, calculations and methodology. No warranty is given and no liability is accepted by Stoic Capital, its directors and officers for any loss arising directly or indirectly as a result of your acting or relying on any information in this update. This publication is not directed to, or intended for distribution to or use by, any person or entity who is a citizen or resident of or located in any locality, state, country or other jurisdiction where such distribution, publication, availability or use would be contrary to law or regulation.