Silver – Forgotten

Zhen Hao


Silver belongs to the Platinum Group Metals or PGMs for short and includes brethren like gold, platinum and palladium. Mined as early as 5th century BC, the shiny, white-looking metal has both consumer and industrial uses given its heat and electrical conductivity. We’ve seen it in jewelry, energy, automobiles and explosives, but most commonly in the coins in our pockets.
Current and historical price of silver
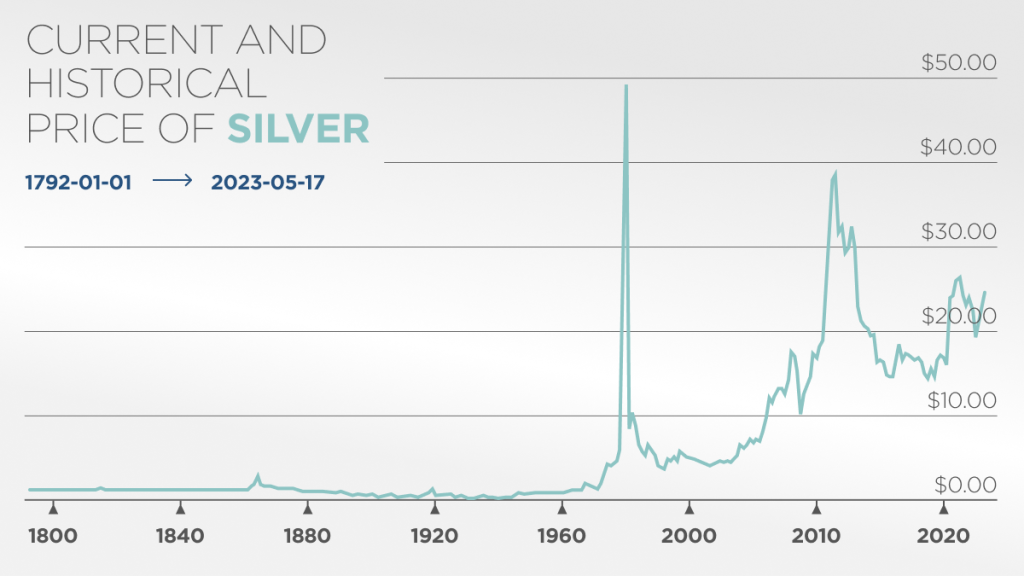
The lowest in values amongst the PGMs, silver futures trades in the largest denomination of 5,000oz. The deceivingly calm price range silver has traded in the past couple of years has us believing a market equilibrium exists in the $24/oz range we are now.
But taking a further look back in time, it is no wonder that silver has earned itself a reputation as being one of the most volatile and highly manipulated metals in this space. Prior to Nixon’s closure of the gold window and years after that, silver traded relatively calmly, right up to 1979 when the Hunt Brothers stepped into the market, driving silver prices from below $10/oz into the stratospheric highs of $50/oz. The Hunt brothers, comprising Nelson Bunker Hunt, Lamar Hunt, and William Herbert Hunt, started amassing silver in the late 1970s, believing it was undervalued due to inflation and the weakening USD. Their aggressive buys naturally led to a cornering of the market on dwindling liquidity, and what followed was a story we’ve seen all too many times in the commodities space.
The spike we witnessed in 2020 reached nowhere near the magnitude of 1980, or 2011 for that matter. The only difference being the that silver was caught up in the wave of social media frenzy as synonymous as Gamestop and AMC were with Reddit’s wallstreetbets – Reddit users allegedly orchestrated a full-on effort to drive up silver prices from the teens into the highs of $28/oz, also known as the ‘Silver Squeeze’. Nevermind that the JPM gold traders Michael Nowak and Gregg Smith were later found guilty of spoofing the gold market later in 2022 – something most suspected to be true for decades, it was the only time retail traders found the power to move markets.
Demand for silver
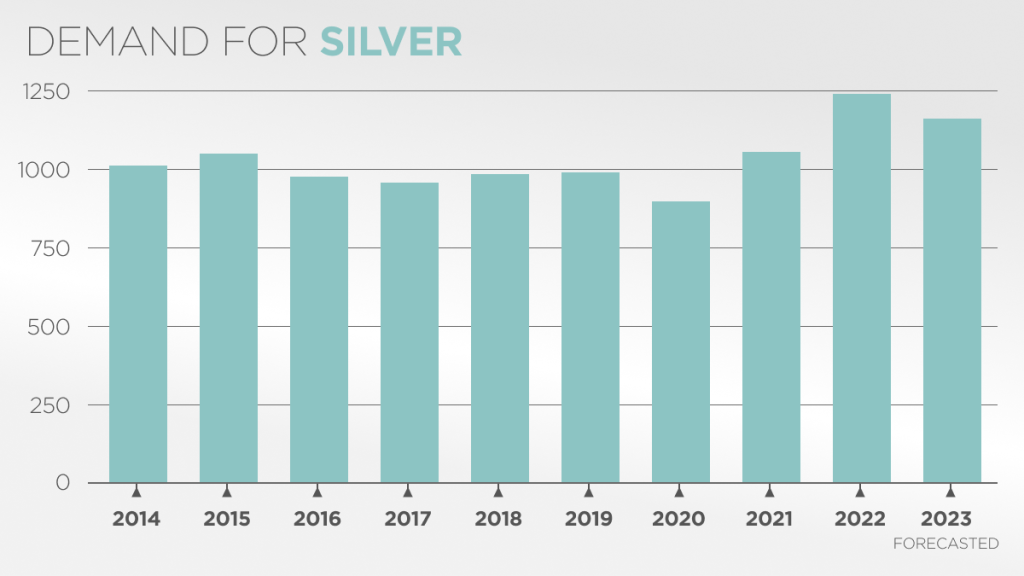
Fundamentally, demand for silver has hovered between 900 million ounces to 1.2 billion ounces from 2014 to 2022 as seen above in figure 2. Much has been talked about silver’s declining use in photovoltaic cells and even jewellery, yet demand has still managed to eke out a compound annual growth rate (CAGR) of 2.3% during the same period. This year’s total demand is projected to be about 1.17 billion ounces.
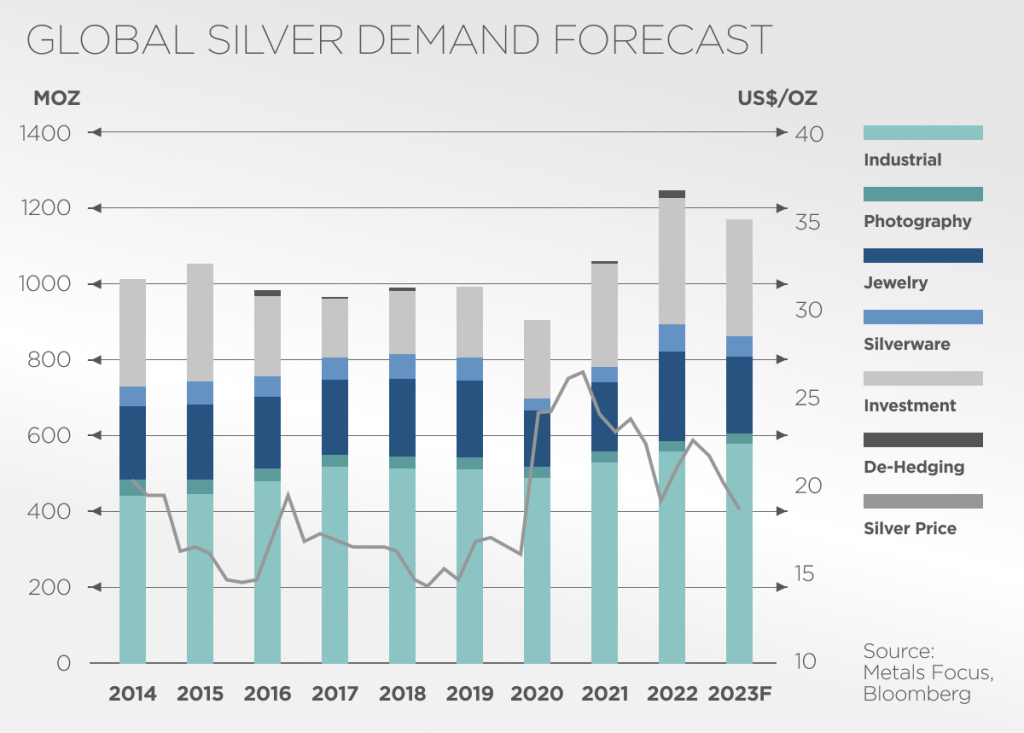
Approximately 60% of silver’s usage is for industrial usage as seen above in figure 3 in light blue. The proliferation of green technology and growing emphasis on ESG has helped support the rise in industrial demand of silver for power grids, electric vehicles, and solar panels.
In the EV space, where growth has been phenomenal, especially in China, the market has been growing at a CAGR of 17.3%. Electric vehicles require approximately 25 to 50 grams of silver just for the battery.
Solar panels or photovoltaic cells has been the other significant source of demand for silver – in 2020, PV use stood at about 12.7% of silver production. It is estimated that an average solar panel uses about 20 grams of silver.
However, the most volatile component of silver demand comes from consumers. Silver demand from jewelry is projected to fall 15% this year. Unsurprisingly, given the increasing bleak outlook for the real economy.
Lastly, silver does have demand from an investment standpoint, albeit less significant than gold given the history of central bank holdings. Nonetheless, this component is non-trivial at just under 20% of total demand.
Supply of silver
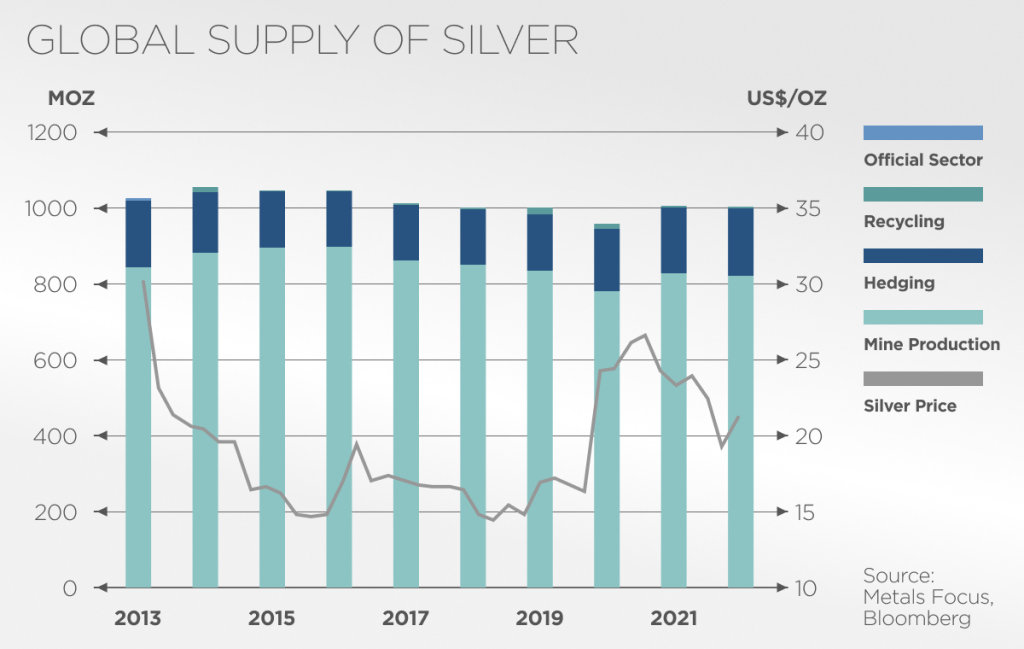
Figure 4 above portrays the supply of silver over the past decade. Supply has been declining even before Covid, before improving significantly in 2021 and 2022. The majority of silver is produced by mine production followed by recycling.
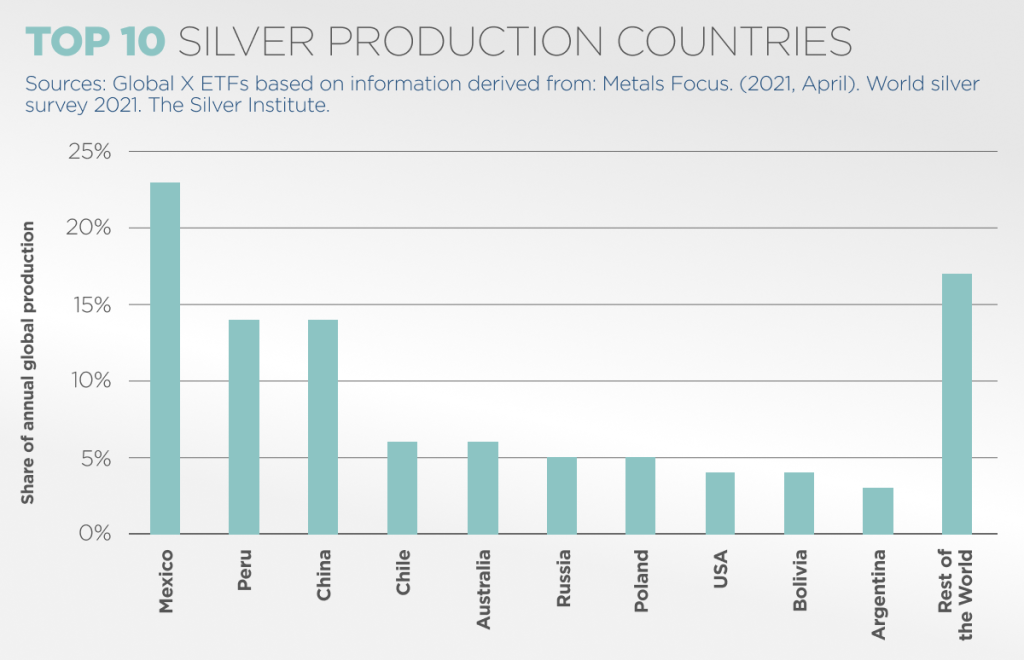
Interestingly, figure 5 indicates that an estimated 56% of the world’s silver production is found in South America – including Mexico, Chile, Bolivia, Argentina and Peru.
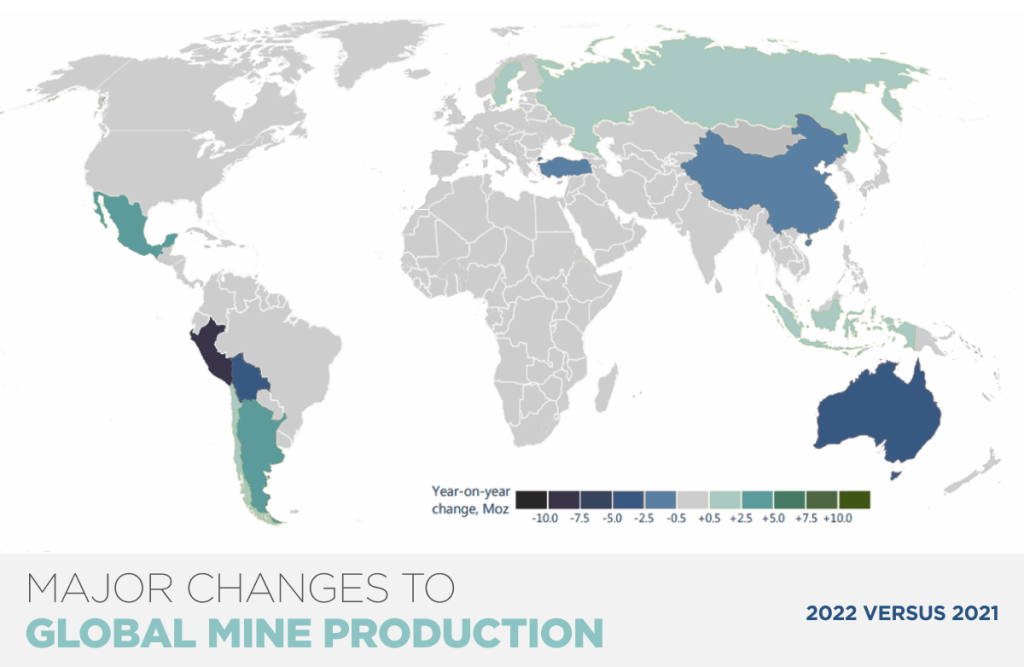
Silver mining production dropped by 0.6% year on year in 2022 (figure 6) mainly due to the decrease in Peruvian, Australian and Bolivian production, partially offset by increases in Mexico, Argentina and Russia. Mined silver supply is expected to increase by 2.4% in 2023, mostly from new projects.
Disruptions to the supply of silver surfaced when Russia invaded Ukraine in 2022, causing silver mining areas to be destroyed as a result of the warfare. Russian silver was also banned from the biggest trading markets in silver (See announcement from the London Bullion Market Association (LBMA) and the Chicago Mercantile Exchange (CME)). While this caused a shortage, it was still nowhere near the magnitude of impact seen in palladium.
Glencore’s involvement in the silver scene
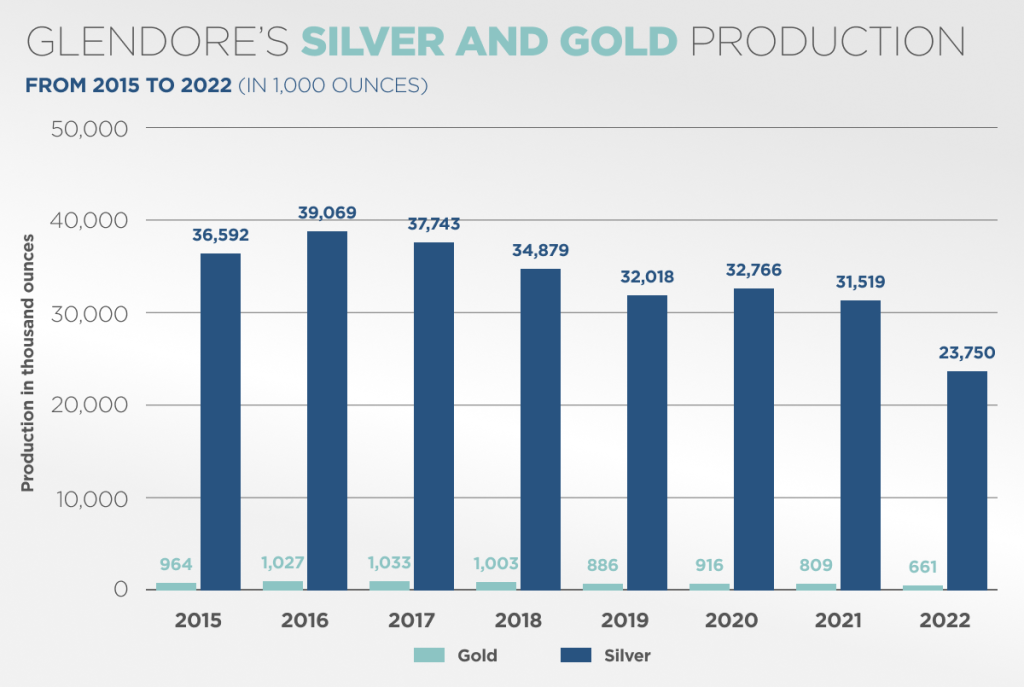
Much has been said about Glencore’s silver production of late – figure 7 above paints a picture of declining production at Glencore’s silver mines since 2016. We take a closer look to see if this is driven by mining issues or corporate maneouverings.
Glencore’s production from their own sources
| Production from own sources – Total | Q1 – 2023 | Q1 – 2022 | Change % | |
|---|---|---|---|---|
| Copper | kt | 244.1 | 257.8 | (5) |
| Cobalt | kt | 10.5 | 9.7 | 8 |
| Zinc | kt | 205.3 | 241.5 | (15) |
| Lead | kt | 39.3 | 46.8 | (16) |
| Nickel | kt | 20.9 | 30.7 | (32) |
| Gold | koz | 187 | 189 | (1) |
| Silver | koz | 4,525 | 6,515 | (31) |
| Ferrochrome | kt | 400 | 387 | 3 |
| Coal | mt | 26.9 | 28.5 | (6) |
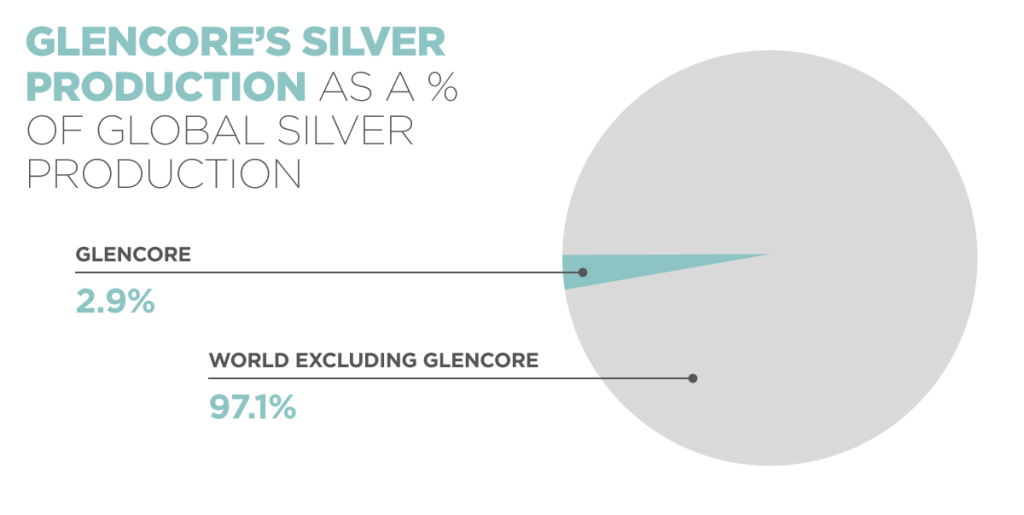
Glencore’s silver production YoY for Q1 2022 vs Q1 2023 shows a sharp drop in production by 31%. Part of this appears to have been coming from the sale of its Los Quenuales zinc, lead, and silver operations to Alpayana S.A.. Perhaps not a bona fide fall in production? Nonetheless, this remains a space worth watching, given that Glencore supplies about 3% of the world’s mined silver.
Glencore’s silver production relative to the world’s
Glencore and Codelco are one of the largest producers of silver
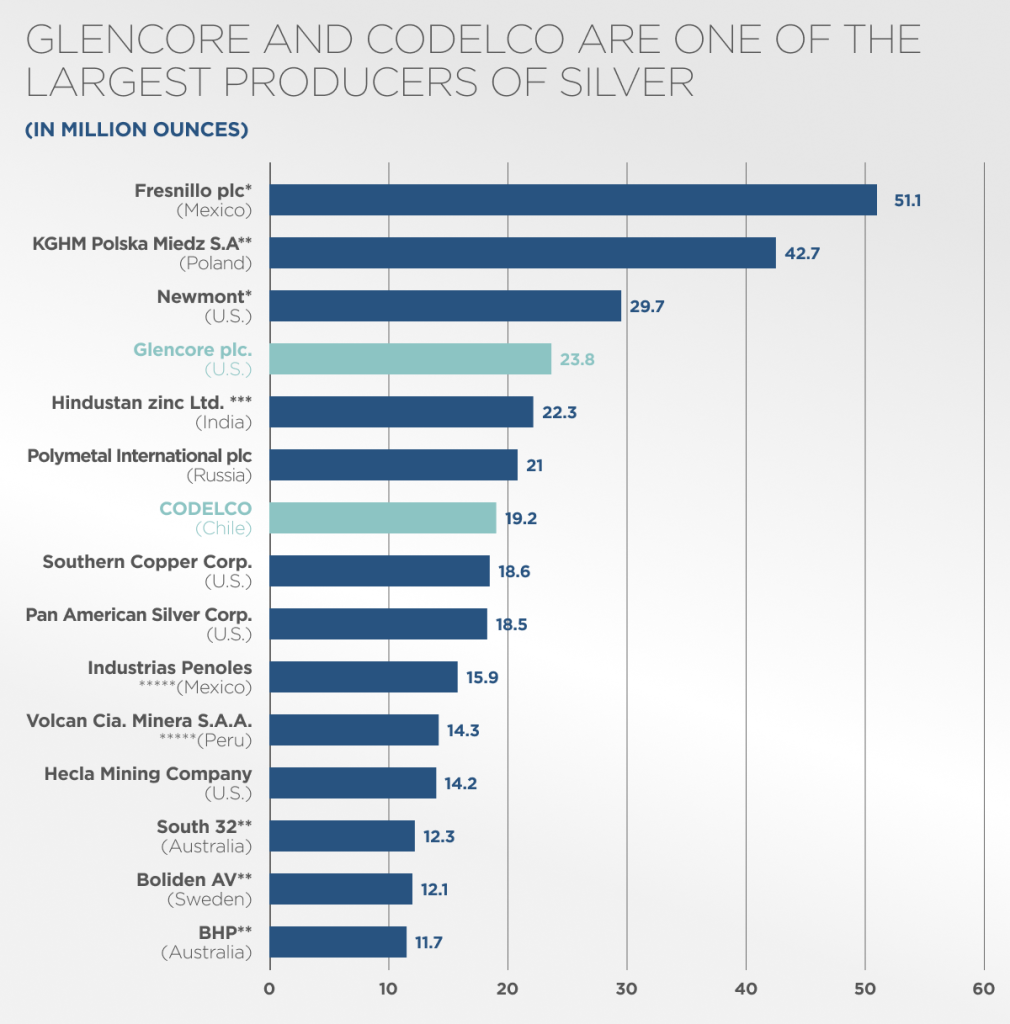
Glencore is the 4th largest producer of silver in the world as shown in green above in figure 10, with competitor Codelco just slightly behind in 7th and in pink.
| Mining Operation | Country | Major owner/ operator | 2020 Ag output, Moz | 2019 Ag output, Moz | % Change | |
|---|---|---|---|---|---|---|
| 1 | KGHM Polska | Poland | KGHM | 29.2 | 40.2 | -2 |
| 2 | Penasquito | Mexico | Newmont | 27.8 | 22.7 | 22 |
| 3 | Dukat | Russia | Polymetal | 18.2 | 19.3 | -6 |
| 4 | Antamina | Peru | Giencore / BHP | 16.4 | 15 | 9 |
| 5 | Saucito | Mexico | Fresnillo | 15.5 | 17.2 | -10 |
| 6 | San Julian | Mexico | Fresnillo | 13.3 | 13 | 2 |
| 7 | Fresnillo | Mexico | Fresnillo | 13.1 | 13 | 1 |
| 8 | Cannington | Australia | South32 | 11.6 | 12.3 | -6 |
| 9 | Chuquicamata | Chile | Codelco | 10.9 | 7.2 | 51 |
| 10 | Greens Creek | USA | Hecla Mining | 10.5 | 9.9 | 6 |
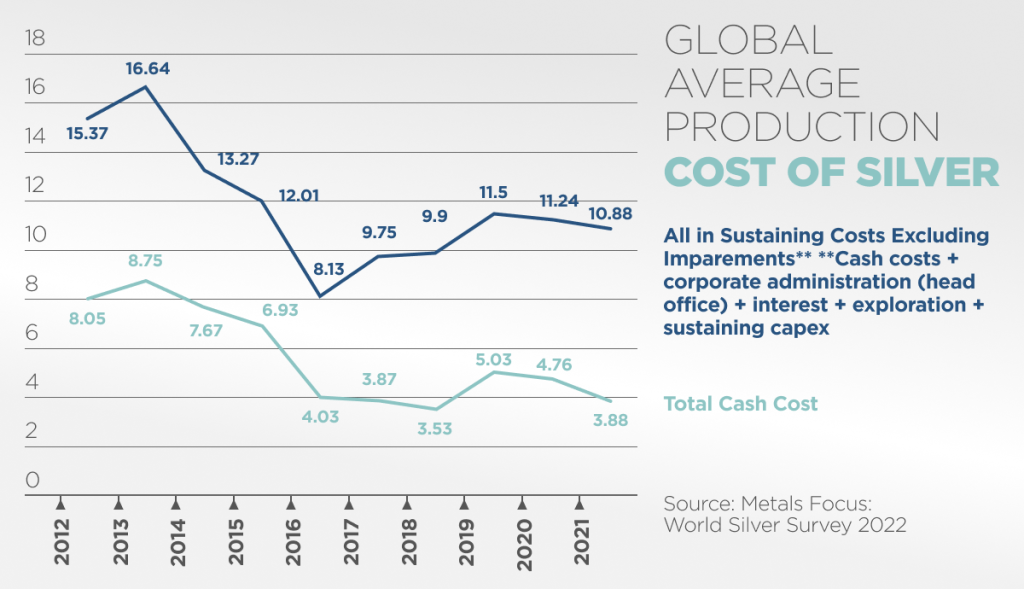
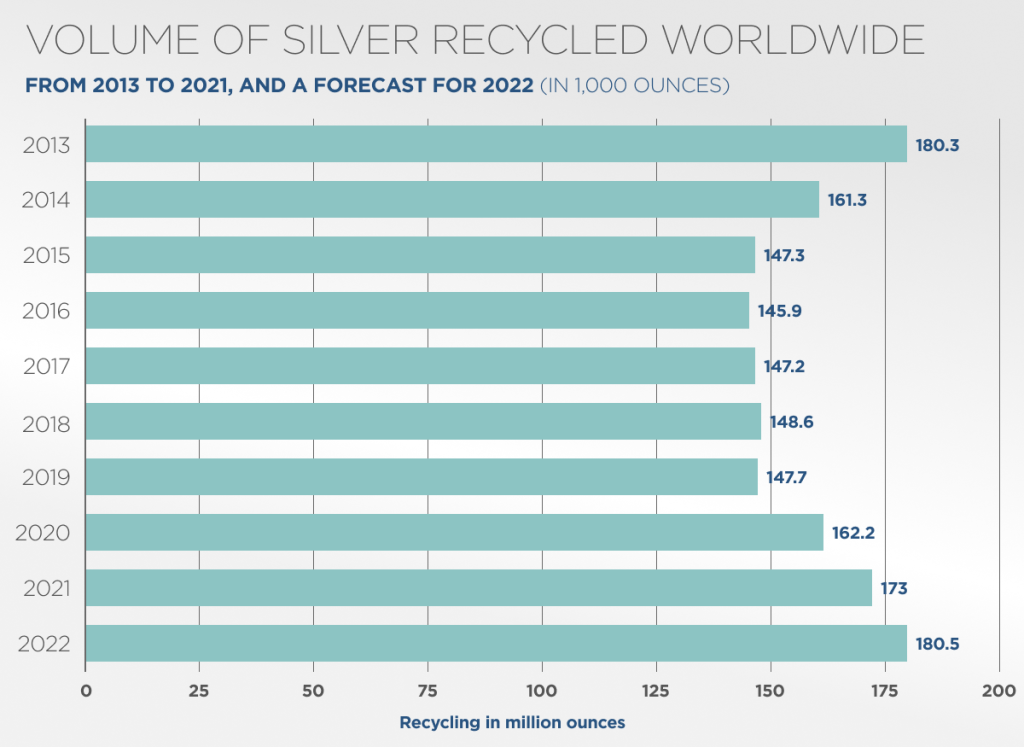
Figure 12 shows a stark picture of declining cost of production for silver, though much work needs to be done in examining the growing cost burden of ESG on miners. But viewed in the context of recycling (figure 13), we’ve observed a closely correlated growth in silver recycling volume from 2016 onwards, possibly driven by the rise in all in costs of production.
The key forward, would be to delve deeper into the recovery in global silver mine production in 2021-2023, to determine the sustainability of the recovery. While demand is unlikely to fade, the declining usage vis-a-vis substitutes warrants closer monitoring against the backdrop of growing production. Either way, the recent calm in prices has provided a limited window to position either way.
Disclaimer
Please refer to our terms and conditions for the full disclaimer for Stoic Capital Pte Limited (“Stoic Capital”). No part of this article can be reproduced, redistributed, in any form, whether in whole or part for any purpose without the prior consent of Stoic Capital. The views expressed here reflect the personal views of the staff of Stoic Capital. This article is published strictly for general information and consumption only and not to be regarded as research nor does it constitute an offer, an invitation to offer, a solicitation or a recommendation, financial and/or investment advice of any nature whatsoever by Stoic Capital. Whilst Stoic Capital has taken care to ensure that the information contained therein is complete and accurate, this article is provided on an “as is” basis and using Stoic Capital’s own rates, calculations and methodology. No warranty is given and no liability is accepted by Stoic Capital, its directors and officers for any loss arising directly or indirectly as a result of your acting or relying on any information in this update. This publication is not directed to, or intended for distribution to or use by, any person or entity who is a citizen or resident of or located in any locality, state, country or other jurisdiction where such distribution, publication, availability or use would be contrary to law or regulation.