A Dive into El-Nino La-Nina Forecasts

Ray Chng

Commodities traders are very much like farmers, albeit less down to earth. Other than monitoring supply and demand trends and geopolitical developments, the one thing we all watch like a hawk – weather. Weather phenomenon like the El Niño Southern Oscillation (ENSO) cycle, have a global impact that determines the fate of both production and logistics.
ENSO what?
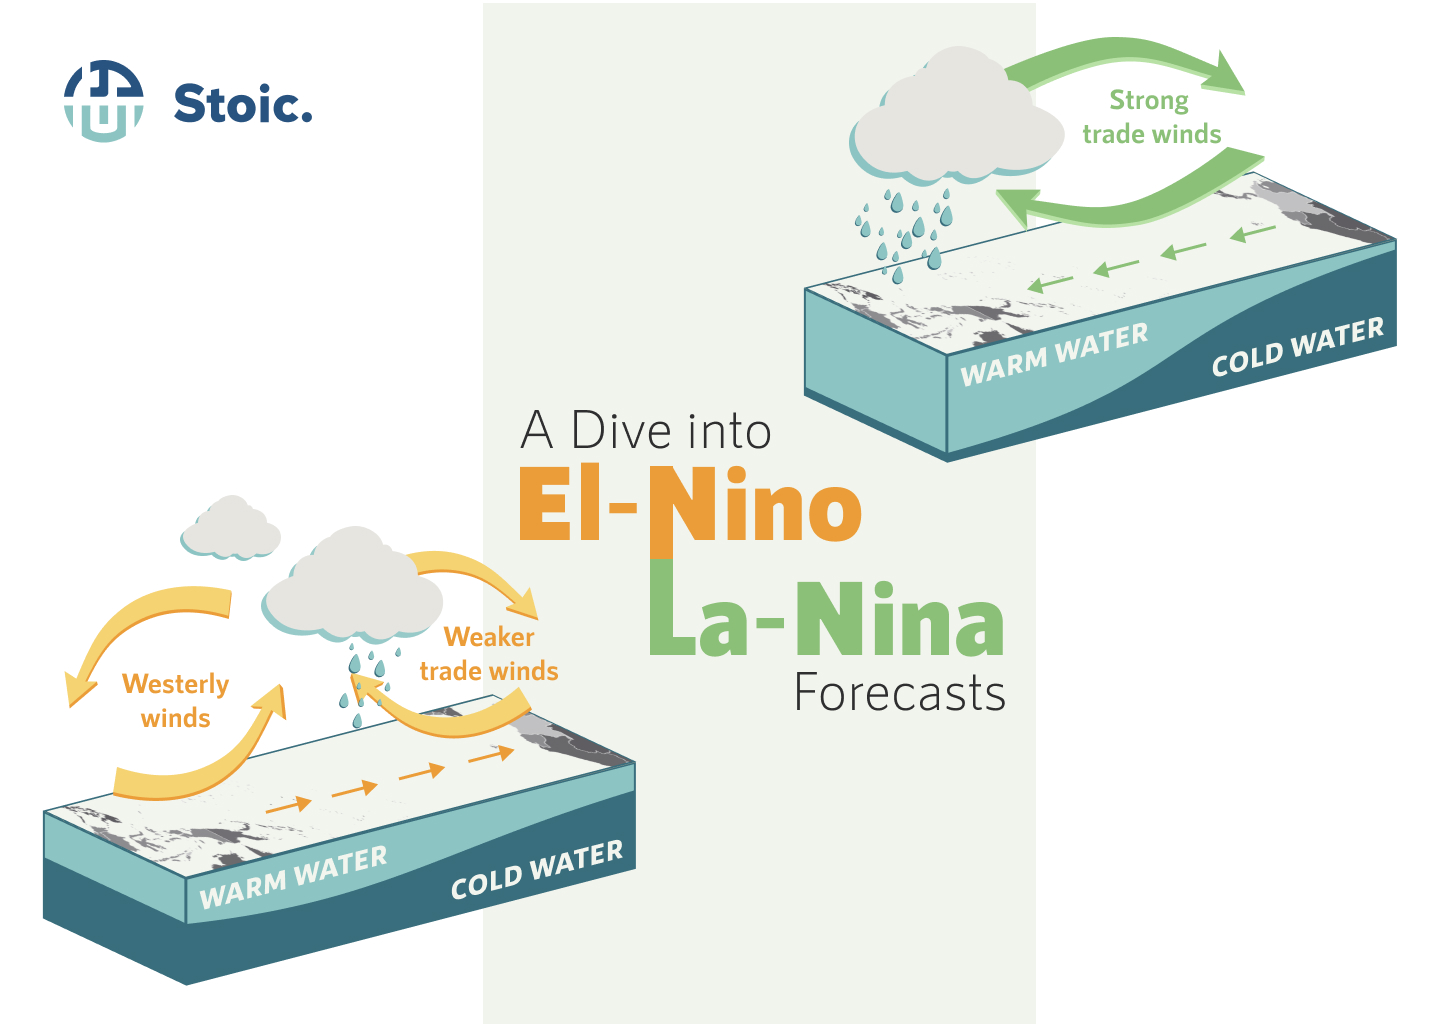
The ENSO cycle is a periodic fluctuation of the Sea Surface Temperatures (SST) in the central and eastern tropical Pacific Ocean. These periods of oscillation typically range from about two to seven years. The SSTs in the tropical Pacific Ocean can warm or cool anywhere from 1°C to 3°C from the average surface temperatures. The changes in the SSTs as well as the strengthening and weakening of trade winds, changes the pressure gradient of the atmosphere over the tropical Pacific Ocean. El Niño and La Niña are extreme phases of the ENSO cycle, and their occurrences brings extreme flooding and/or drought to different continents.
To properly quantify the occurrence of an El Niño or La Niña, scientists have commonly used the Niño 3.4 region (indicated in the diagram below) to measure SST anomalies.
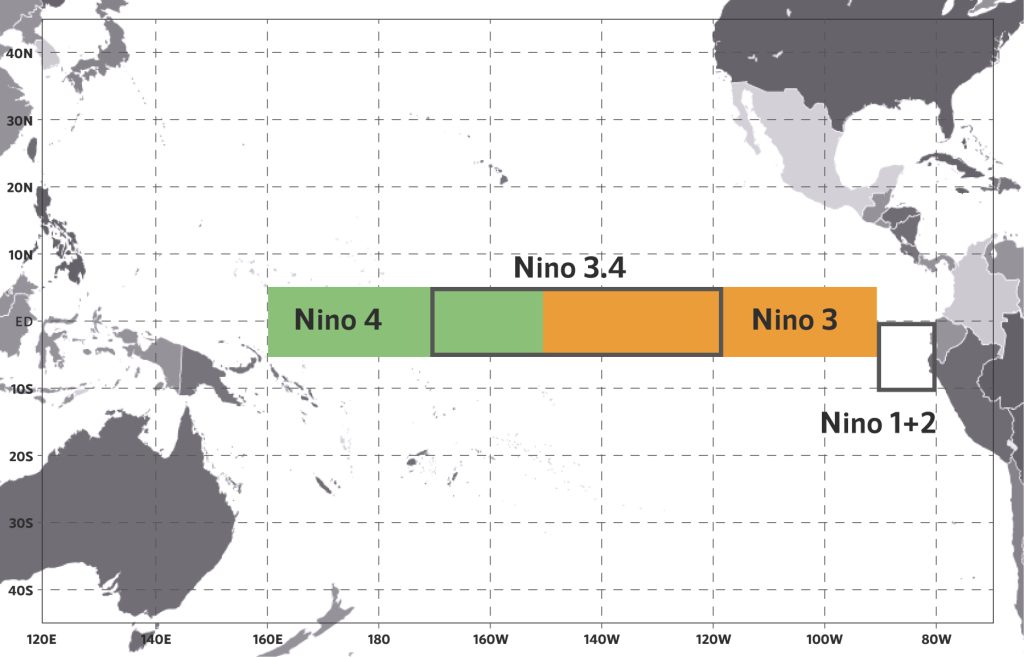
According to the National Oceanic Administration (NOAA), an official El Niño occurs when the five consecutive 3-month running mean SST anomalies exceeds the threshold of 0.5°C. An official La Niña when the mean SST anomalies drops below the threshold of -0.5°C.
Historically, we see a clear oscillation between El Niño and La Niña occurrences. A period of El Niño typically will follow a La-Nina phase, hence the constant oscillation. Since 1950, the deviations in mean SSTs for the strongest El Niño exceed that of La Niña, with the 2015-2016 El Niño reaching almost 2.6°C in SST anomaly.
The impact of the ENSO cycle phenomenon can be devastating. Typically during an El Niño, central and southern South America is more likely to receive flooding rains, while Australia and Southeast Asian locations are more likely to experience extended periods of drought. During a La Niña, the pendulum shifts, with extreme rains being more likely in Southeast Asia and Australia, and higher probability of drought in parts of South America. This however isn’t a rule set in stone, as the unpredictability of weather patterns can mean differing impacts from one El Niño/La Niña to the next.
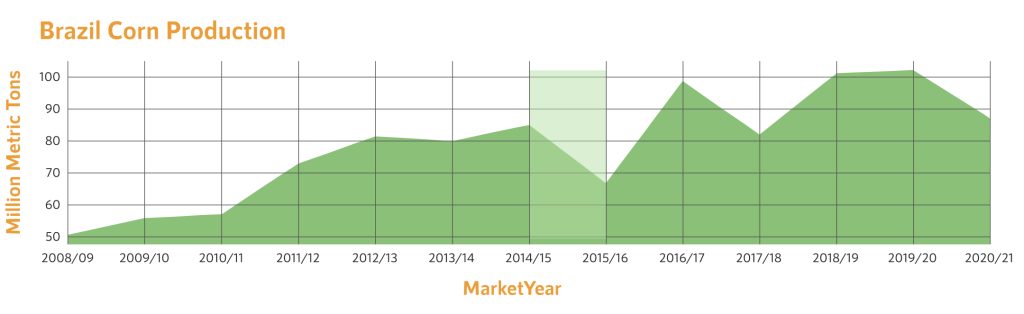
What is definitely certain about the ENSO cycle is the severity of its impact on agriculture production during extreme occurrences in Australia, Southeast Asia and South America. The 2015-2016 El-Niño brought extreme drought and varying rainfall conditions to Africa, South America and parts of Asia. Harvest of various crops and thus regions’ food security were greatly affected. The graph below charting Brazil’s historical corn production values insinuates the dip in production caused by the 15/16 El-Niño, which dropped by 21% from the previous market year.
The Weather Crystal Ball?
Fortunately, there is an abundance of ENSO research globally built up over more than a century. Meteorological agencies and research institutions like the NOAA and BoM in Australia release regular monthly forecasts of SST and SOI values and guidance for future developments of El-Niño or La-Niña. In an ideal world, these forecasts would be a perfect indicator of the likelihood of an El-Niño/ La-Niña, which will be invaluable information to farmers, government bodies and commodity traders. But of course in reality, forecasts can only provide a certain degree of accuracy. Thus, we aim to investigate the accuracy and performance of these historical ENSO forecasts provided, to understand to what extent can traders accommodate the forecasts in their trading toolbox.
Forecast Data
We want to investigate two types of forecast data that is available:
- International Research Institute for Climate and Society (IRI) SST Anomalies Forecasts
- IRI probabilistic ENSO forecasts
IRI SST Anomalies Forecasts
The IRI aggregates the forecasts results from various forecast models into one location, which makes it easy to visualize the vast number of forecast models with varying methodologies and performance. These models will provide monthly forecasts for up to nine overlapping 3-month periods. The 3-month periods are abbreviated by the starting letter of the month. For example, the 3-month period for Jan-Feb-Mar will be referred to as JFM.
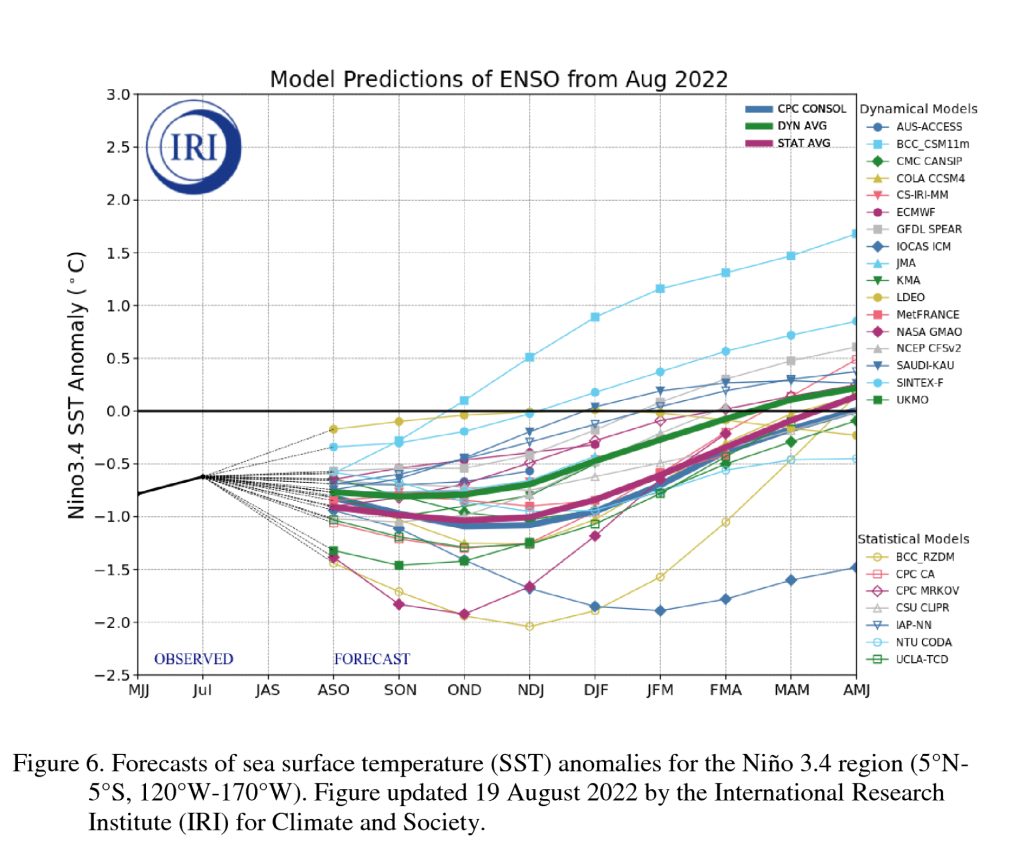
On the 19th of each month, the IRI will release the updated forecasted values for the given month on its website. For example, the forecasts issued on 19th July 2022 will provide forecasts for JAS, ASO, SON, OND, NDJ, DJF, JFM, FMA, and MAM. Each forecast value gives the projected average three-month SST anomaly for each period.
The IRI have made historical SST forecasts and present values readily available through their website.
To carry out our investigation, we will aggregate all forecasted values and take the average across all models for each specific timeframe.
Visualisations
Plotting the observed SST values together with the monthly forecast values from 2004 to 2022 produces a very interesting visualisation. The monthly forecasted values are multi-coloured, while the observed SST values is the continuous black line. We see that the trends of the forecasted values are generally similar with the actual values. However, there exist large pockets of errors and variation, particularly during the peaks and troughs (2015-2016 El-Niño, 2007-2008 La-Niña). From a purely visual perspective, we see that accuracy of the forecasts tend to decrease as the forecasting horizon is stretched further out. This is observed in the variation of forecasted-observed values at the tail ends of the forecasted lines.
We grouped the forecasted values based on their respective forecast horizons (T+1, T+2, … , T+9) to gain a better visualisation of forecast accuracy. We see that the nearer-term forecast horizons (T+1, T+2, T+3) are better predictors of final observed SST values as compared to forecasts of further term horizons. This makes intuitive sense as the strength of the forecasts decreases as it attempts to predict values further into the future.
We then further plotted the forecast errors of the various forecast horizons. Negative error values mean that the forecast overpredicted the actual values, while positive error values mean that the forecast underpredicted the actual values. In line with forecast accuracy intuition, the errors of the T+1 forecast horizon has the lowest variation. T+9 forecast horizon has the weakest predictability strength.
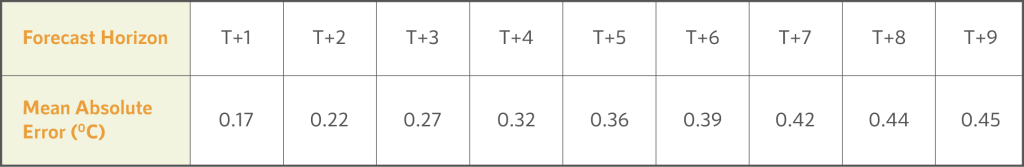
Calculating the Mean Absolute Errors (MAE) further reiterates the drop in forecast accuracy across forecast horizon. The MAE across forecast horizons are positive, which suggests that on average, the forecasts under predicts the actual SST anomaly values. This could be attributed to the forecasts unable to accurately predict extreme El-Niño or La-Niña events.
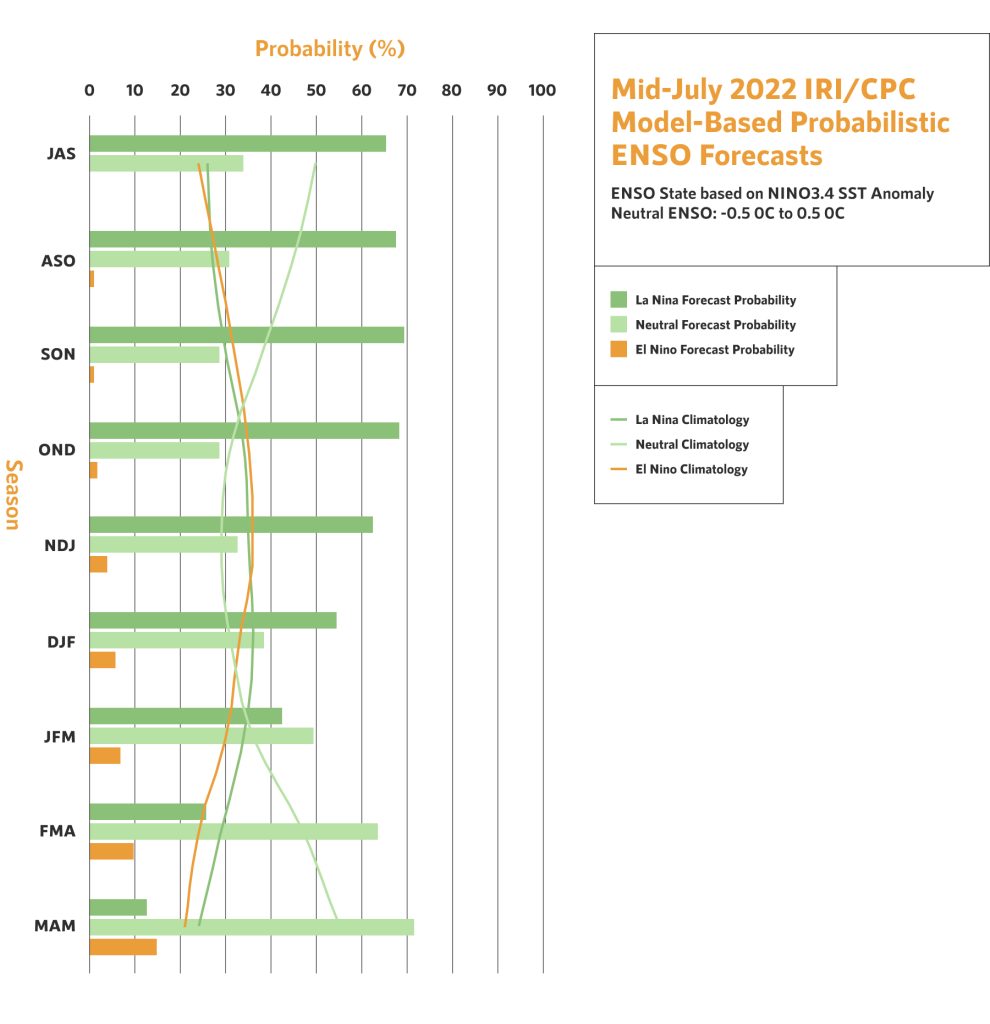
IRI SST Probabilistic Forecasts
The IRI also produces probability forecasts of the occurrence of an El-Niño/La-Niña, apart from forecasting SST anomalies. The probabilistic forecasts shows the likelihood of an El-Niño, La-Niña or a neutral state. These probability forecast are calculated using regression, with the inputs being the aggregated SST anomalies from the various models. The probabilities across the three states will sum up to 1.
Similar to the SST forecasts, the IRI probabilistic forecast provides monthly forecasts for up to nine 3-month overlapping periods. The probabilistic forecast data is readily available here.
Visualisations
Plotting the El-Niño and La-Niña probabilities against the observed SST anomaly values yields a very interesting graph. At times of extreme El-Niño/La-Niña, the probability forecasts appear to break down, as can be seen by the probabilistic forecasts adjustments during the 2015-2016 El-Niño and 2007-2008 La-Niña. Generally, the probabilistic forecasts given by the long-term forecast horizons don’t appear too accurate.
After grouping the forecast horizons for the probabilistic forecasts, we can see a clearer picture of the better performance of the near-term forecast horizons. After isolating the T+1 horizon and the observed SST values, we can see that once the El-Niño probability hits around 85% or above, an actual El-Niño (of various magnitudes) will surface. Sustained high probabilities after the initial forecast will strengthen the conviction of the occurrence of an El-Niño (Look at 2015-2016 El-Niño).
Turning to La-Niña, after isolating the T+1 forecast horizon, we see similar patterns to that of El-Niño. High probabilities of a La-Niña (85%) would likely mean an actual occurrence of an event.
The chances of a false positive is rare, in fact every time T+1 probability hits above 85%, an actual La-Niña event is observed.
Current La-Nina Conditions
As of the latest July ENSO forecast released by the IRI, T+1 to T+3 forecast horizon La-Nina predictions remains are fairly probably levels of high 60s to 70 percent chance of occurrence. We can expect a moderate-high likelihood of a La-Nina continuation into boreal fall. Investors should closely follow the monthly forecast updates for any spike in La-Nina probabilistic levels above 80%, which could well signal a prolonged La-Nina.
Conclusion
From our analysis, we observe that the forecasted values do provide reasonable predictions on future SST anomalies and thus probabilities of El-Niño/La-Niña occurrences. Even though forecasts are released up to nine months into the future, the accuracy of said forecasts degrades over time due to increasing uncertainty. The most useful forecasts horizons to commodity traders appear to be T+1 up to T+3.
Further work will be to conduct statistical analysis to uncover significant relationships between ENSO SST anomalies forecasts and various outputs such as production/yield/prices of differing commodities. El-Niño/La-Niña has varying impact on different types of commodities from different regions, thus this analysis will have to be conducted on a more micro scale.
Disclaimer
Please refer to our terms and conditions for the full disclaimer for Stoic Capital Pte Limited (“Stoic Capital”). No part of this article can be reproduced, redistributed, in any form, whether in whole or part for any purpose without the prior consent of Stoic Capital. The views expressed here reflect the personal views of the staff of Stoic Capital. This article is published strictly for general information and consumption only and not to be regarded as research nor does it constitute an offer, an invitation to offer, a solicitation or a recommendation, financial and/or investment advice of any nature whatsoever by Stoic Capital. Whilst Stoic Capital has taken care to ensure that the information contained therein is complete and accurate, this article is provided on an “as is” basis and using Stoic Capital’s own rates, calculations and methodology. No warranty is given and no liability is accepted by Stoic Capital, its directors and officers for any loss arising directly or indirectly as a result of your acting or relying on any information in this update. This publication is not directed to, or intended for distribution to or use by, any person or entity who is a citizen or resident of or located in any locality, state, country or other jurisdiction where such distribution, publication, availability or use would be contrary to law or regulation.