The Silver Tsunami: Life is a Ponzi.


Ray Chng

A Greying Population
In late 2015, China ended its one-child policy, replacing it instead with a 2-child limit. The move signified a paradigm shift in the Chinese government’s family planning policy. A stubborn decline in birth rate following the announcement led to an even more aggressive shift towards a 3-child policy in 2021. The urgency with which the Chinese government has reversed its 35-year old policy speaks volumes of the looming impact ahead.
The implications of these actions are non-trivial. Everything in life is a ponzi scheme, one variation or another, and populations are no different. A reduced influx or growth rate reduces the pool of distributable benefits to the existing population. Additionally, a disproportionate non-economically active ageing population places a greater burden on all aspects of a country – fiscal, healthcare and transport to name a few. The economically active population now shoulders the burden of providing for the older generation, as well as its own and the one after it. This phenomenon was particularly stark in China, where working adults with no siblings faced not only Jack Ma’s 9-9-6 challenge, but also a 4-2-1 problem – supporting both parents (2), all four grandparents (4), and alone (1). In some cases, the working adults have simply given up or “躺平”, choosing either singlehood or a childless life rather than sandwiching themselves with an additional 3 children to the equation. This was just statistics, we haven’t even begun to delve into notions of filial piety. So, it’s no wonder the Chinese government is alarmed.
China is not alone. Even our much revered and late founding father Lee Kuan Yew once lamented Singapore’s declining fertility rate:
“I cannot solve the problem, and I have given up. I have given the job to another generation of leaders. Hopefully, they or their successors will eventually find a way out.”
Even he knew the gravity of the problem ahead way back in 2012:
“If we go on like that, this place will fold up, because there’ll be no original citizens left to form the majority, and we cannot have new citizens, new PRs to settle our social ethos, our social spirit, our social norms…”
While we’re concerned at the national level, we’re even more alarmed at the global level where major countries worldwide are starting to grapple with the problem of not just an ageing population, but a declining one. After all, sustainability and environmental issues take a whole new spin if our population declines enough.
We’re keen to avoid a “stroll into mediocrity”, and for that we look to the country with the world’s most aged population – Japan. Japan’s population has been in decline since 2011, with the highest proportion of elderly citizens in the world.
Analysis of Data
We examined the population dataset from the World Bank across a pool of developed countries for the period 1960-2021: United States, China, Japan, Australia, Canada and United Kingdom.
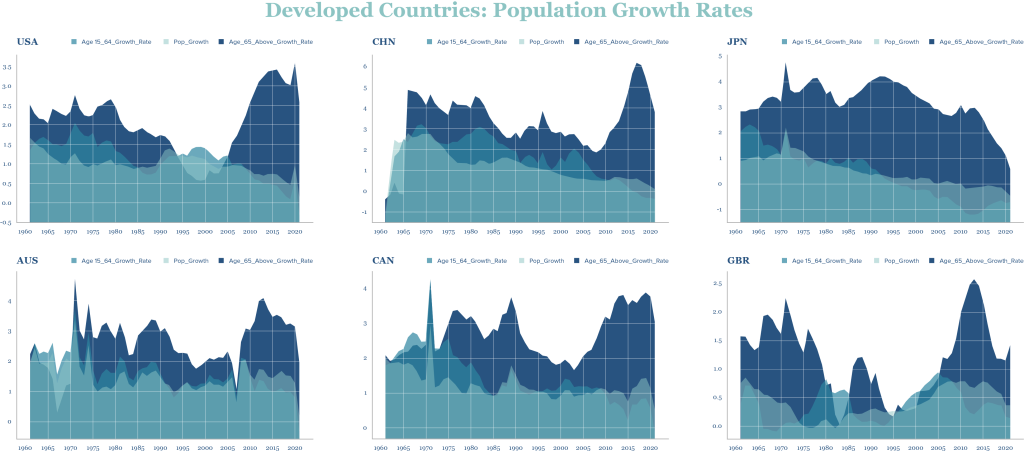
The graphs above plot the growth rates for the total population (Pop_Growth), growth rates of those aged 15-64 (Age15_64_Growth_Rate) and growth rates of those aged 65 and above (Age_65_Above_Growth_Rate).
We observe a prevalent and general decline in the population growth rates for the total population and for those aged 15-64. In the most recent decade, total population growth rates across the countries are fast approaching negative territory, with the exception of Japan whose population has already been in decline since 2011. The other noticeable trend has been the increasing growth rates for those aged 65 and above, driven perhaps by the baby boom between 1940 and 1960, and the only exception being China where this particular metric has seen a persistent decline – warrants some further analysis.
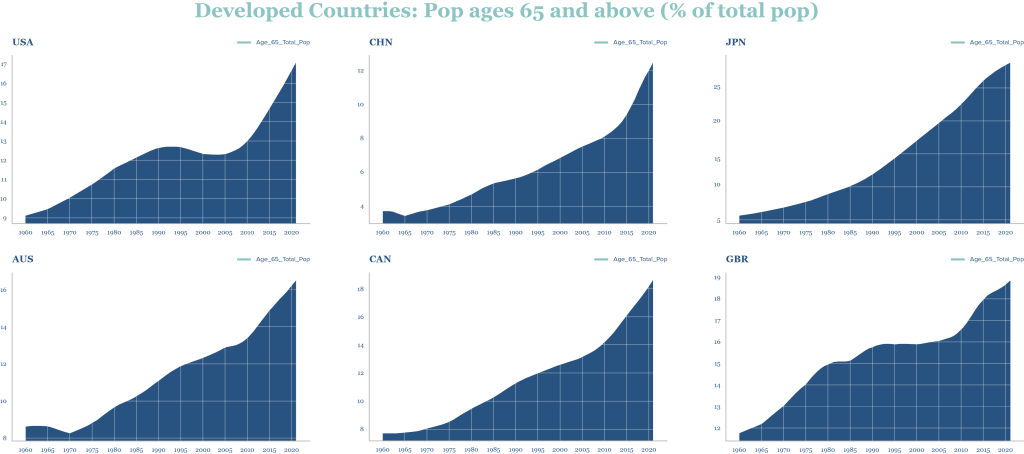
Another unmistakable trend here. Japan leads the way with the segment of the population above age 65 making up 28% of the total population. The other countries are fast approaching the 20% mark. China has the lowest percentage at ~12% in 2021, which seems in line with the declining growth rate in this population segment seen earlier.
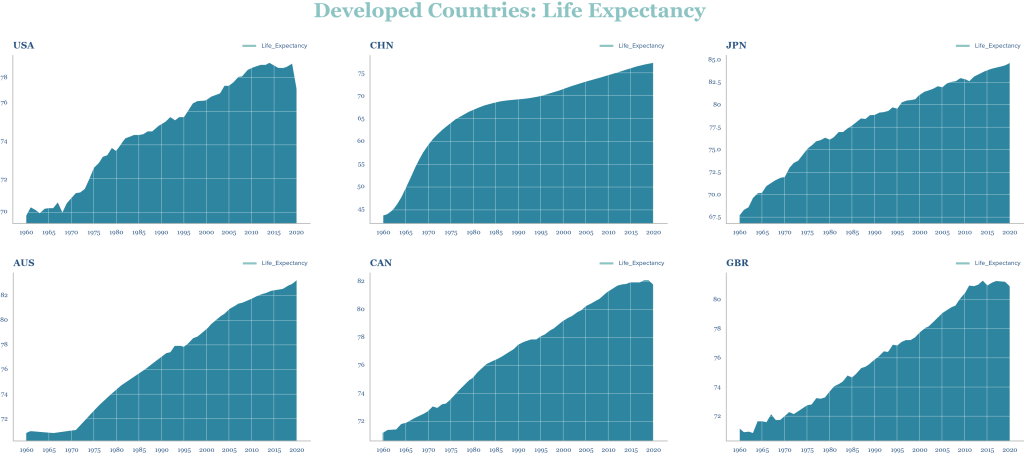
Life expectancy forms a key piece of the puzzle. While the trend here is again undeniable across the countries, it’s worth noting that China has the lowest life expectancy amongst the group ~77 compared to Japan ~85. Logically speaking, we would expect a positive trend and a higher life expectancy number given technological advances in medicine and healthcare, and that this would lead to a swelling of the population segment for those above 65 years.
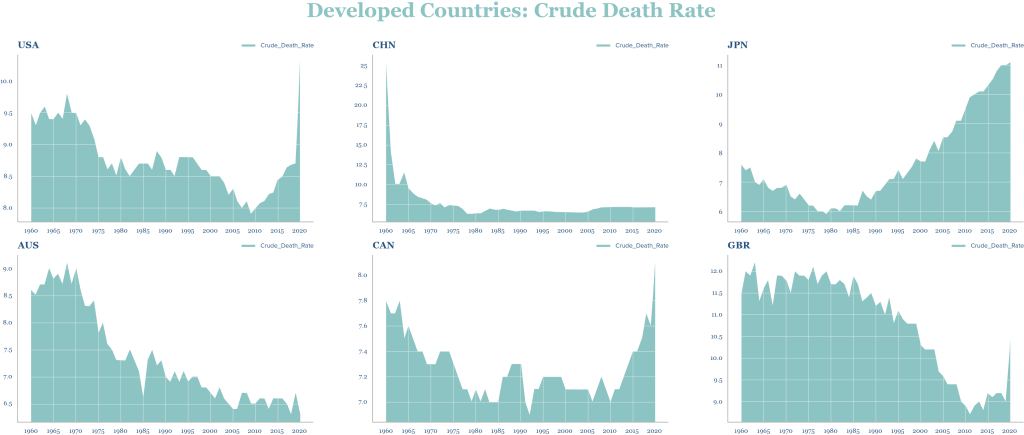
Crude death rate indicates the number of deaths occurring during the year, per 1,000 population. Comparing this metric across the developing countries yields a few notable observations.
We see that unlike the rest of the countries that generally show decreasing crude death rates since 1960, Japan shows a steadily increasing death rate since 1980. While there may be many external factors leading to an increasing death rate, an ageing population would most certainly be one of them. After all, no one lives forever.
The abnormal spike we observe in the 2020-21 crude death rates for certain countries like United States, Canada and United Kingdom most likely stemmed from the Covid-19 pandemic.
Consolidation
To sum up our observations from this set of countries:
- Total population growth rates have been steadily declining, and are likely to turn negative in the next 3-5 years;
- Growth rates for the population segment age>65 have grown steadily and likely to remain high;
- Proportion of population age>65 increasing, possibly approaching Japan’s current 28% and where China has the greatest potential at 12%;
- Increasing life expectancy over time, possibly supporting growth rates of the population segment age>65;
- Generally decreasing crude death rates across the countries, except for Japan which has shown a steady increase – is Japan ahead of the curve?
Investment Opportunities: Where art thou?
While it’s important to understand the trend of various consumption patterns amongst GenZ, we’re also cognisant of the undying certainty of death and taxes. If Japan is anything to go by, it looks to us that the population segment age>65 is likely to be a formidable consumption force to be reckoned with. The length of time that a consumer spends in this segment (20 years for Japan) is also undeniably longer than a GenZ-er (<10 years).
Some possible market opportunities in this space: longevity technology, pharmaceuticals and biotech, robotics, mobility, accommodation, assisted living and rehabilitation/therapy. These sectors aim to capitalize on catering to the needs of an increasing ageing population as they live out the rest of their lives.
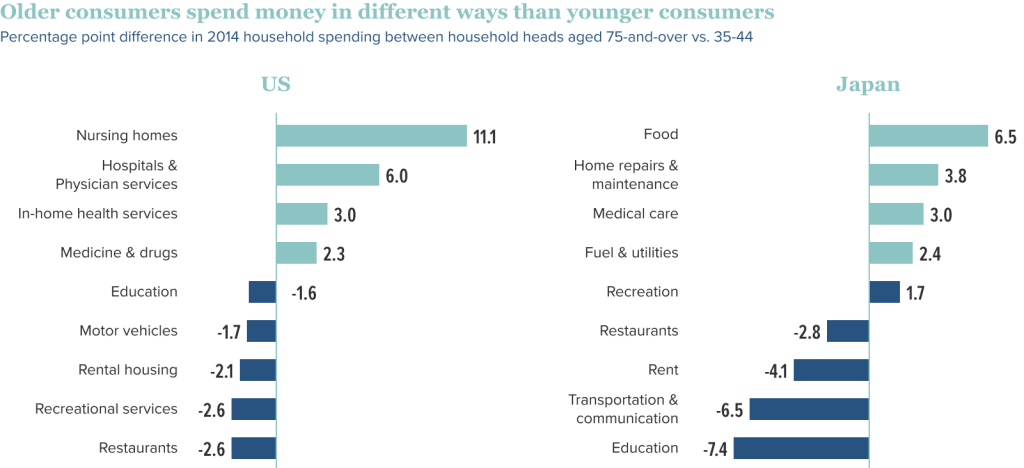
In addition, the change in consumption patterns arising from an ageing demographic can be stark. Older consumers tend to spend more on healthcare services, and less on education and food & beverage, etc.
What about Afterlife Services?
Here at Stoic Capital, we feel that a particular industry has remained overlooked amidst the current trend towards environmental sustainability or even discussions around a growing ageing population segment: the afterlife or funeral industry.
As morbid as it may be, an expected increase in the crude death rate portends a strong demand for afterlife services. However much we expect life expectancy to increase, death is inevitable. An increase in the proportion of countries’ population aged 65 and above, is likely to support an increase in the crude death rate, as was evident in the case of Japan. Japan may have the world’s highest life expectancy, but that hasn’t tapered demand for afterlife services.
Constructing a Portfolio of Afterlife Stocks
We constructed a portfolio of publicly listed international funeral services related equities against the S&P 500 index. The equities in the portfolio comprise companies that have at least one function that is related to funeral services or related merchandise. The portfolio weights were derived using a simple custom scoring system, based on a handful of fundamental parameters. Rebalancing takes place every quarter after incorporating the various companies’ earnings reports.
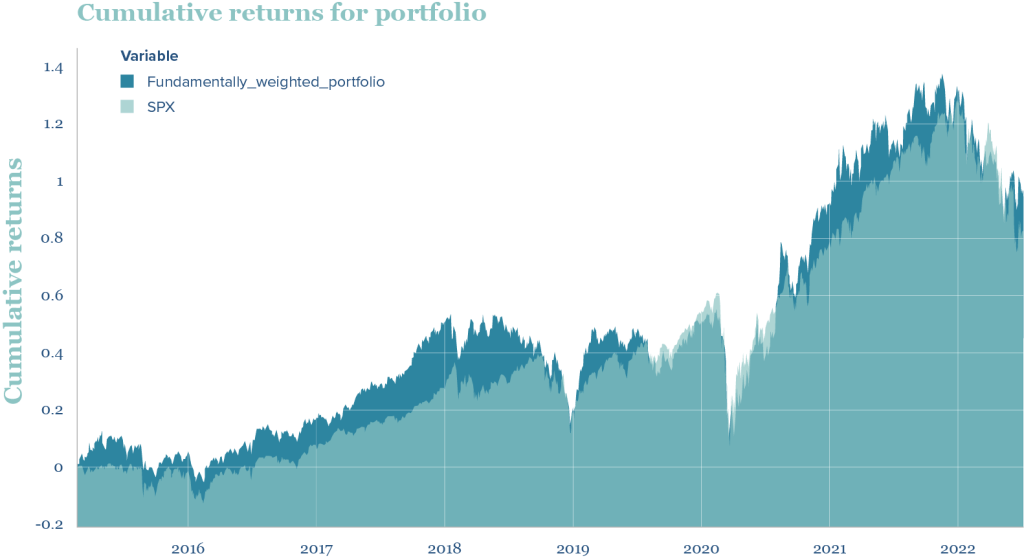
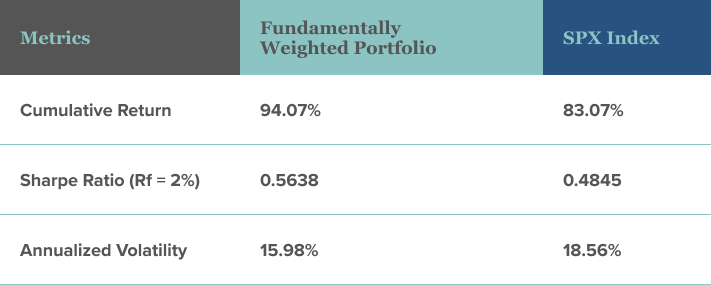
Above, we compare the historical cumulative returns between the portfolio and the S&P 500 for the period February 15 2015 (45 days after the end of Q4 2014) to 7 July 2022. Over the course of 7+ years, the funeral stocks portfolio had higher cumulative returns than the S&P500 for about 83.9% of the time. As of 7 July 2022, the portfolio beat the S&P500 by 11%. Below are some simple metrics for comparison:
Conclusion
The silver tsunami is approaching us like the wave on Miller’s planet on Interstellar. It’s something everyone has talked about for the past few decades but few have realised it’s already here. Unique market opportunities exist for investors to explore: in both end-of-life and afterlife services. Something not to be overlooked amidst the hype of climate change.
Disclaimer
Please refer to our terms and conditions for the full disclaimer for Stoic Capital Pte Limited (“Stoic Capital”). No part of this article can be reproduced, redistributed, in any form, whether in whole or part for any purpose without the prior consent of Stoic Capital. The views expressed here reflect the personal views of the staff of Stoic Capital. This article is published strictly for general information and consumption only and not to be regarded as research nor does it constitute an offer, an invitation to offer, a solicitation or a recommendation, financial and/or investment advice of any nature whatsoever by Stoic Capital. Whilst Stoic Capital has taken care to ensure that the information contained therein is complete and accurate, this article is provided on an “as is” basis and using Stoic Capital’s own rates, calculations and methodology. No warranty is given and no liability is accepted by Stoic Capital, its directors and officers for any loss arising directly or indirectly as a result of your acting or relying on any information in this update. This publication is not directed to, or intended for distribution to or use by, any person or entity who is a citizen or resident of or located in any locality, state, country or other jurisdiction where such distribution, publication, availability or use would be contrary to law or regulation.