Climate Analysis: Droughts in Brazil

Yi Ming L.

Angel T.
Brazil has a long history of grappling with droughts, and two notable events in recent years underscore the severity of this environmental challenge. The 2015-2016 Amazonian drought and the 2019 Pantanal drought stand out as critical episodes in Brazil’s struggle against water scarcity. This article aims to quantify the severity of these droughts through spatiotemporal measures, focusing on Temperature, Humidity, and Precipitation. The weather data source is Visual Crossing’s data, used to generate a dashboard for visualizing the data.
2015 Amazon Drought (2015-2016):
The 2015 Amazonian Brazil drought was a severe dry spell that affected the Amazon rainforest region in Brazil. It occurred from June to October 2015 and was characterized by significantly reduced rainfall, leading to water shortages in rivers and impacting the vast and ecologically crucial rainforest. The drought had widespread environmental consequences, including increased forest fires, loss of biodiversity, and threats to indigenous communities relying on the forest for their livelihoods. The event raised concerns about the resilience of the Amazon rainforest to climate change and highlighted the importance of addressing environmental issues to preserve this vital ecosystem.
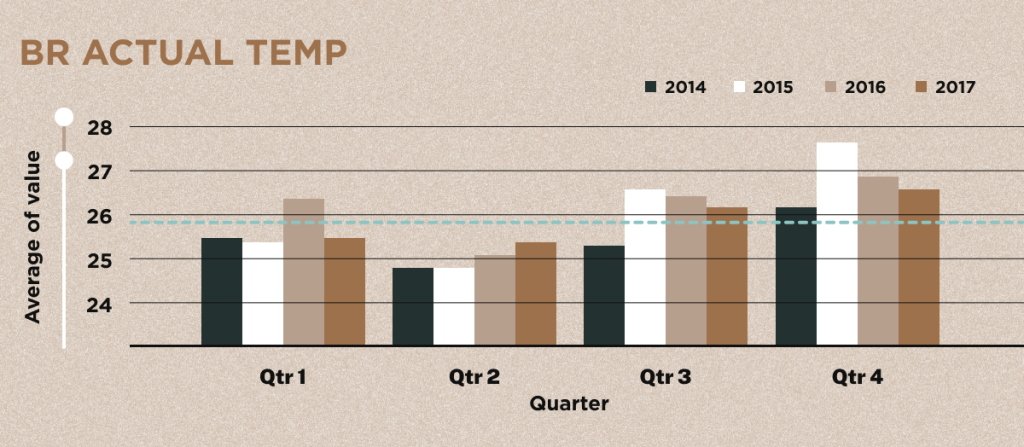
During the drought, particularly in the third and fourth quarters, temperatures notably increased compared to the surrounding years (2014-2015 and 2016-2017). The peak temperature of 28.16°C in October 2015 was the highest recorded during the analyzed period.
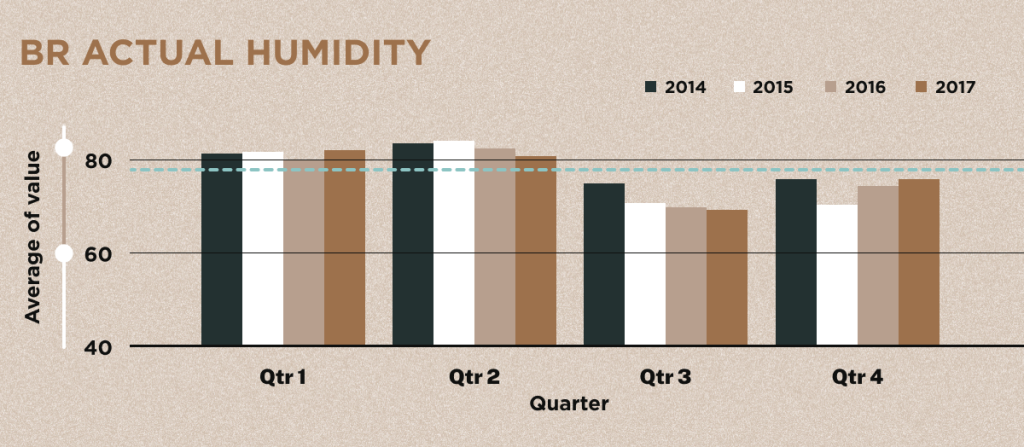
Consistent lower humidity levels during the third and fourth quarters of 2015 were observed. Specifically, the average humidity in the fourth quarter was 70.17%, contrasting with the range of 74.17% to 75.55% in adjacent years.
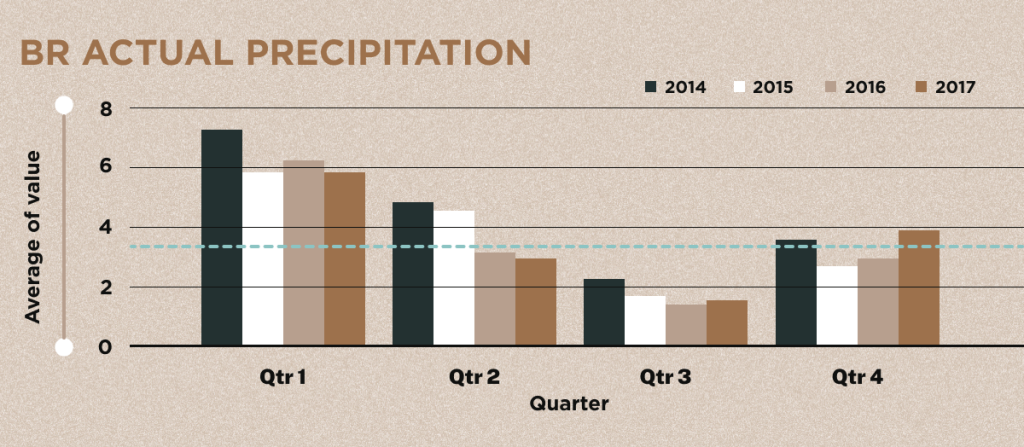
A consistent pattern emerged in precipitation data, particularly towards the end of the third quarter and throughout the fourth quarter. Comparison across different years indicated that 2015 exhibited the lowest precipitation levels, emphasizing a distinct trend of reduced precipitation.
In summary, the analysis of data from 2014 to 2017 reveals distinctive climatic patterns during the drought period of 2015-2016. The third and fourth quarters of 2015 exhibit elevated temperatures compared to surrounding years, along with consistently lower humidity levels and reduced precipitation. These findings highlight the unique climatic conditions during the specified drought period.
2019 Pantanal Drought (2019):
The 2019 Pantanal drought was a severe environmental event that affected the Pantanal, one of the world’s largest tropical wetlands located primarily in Brazil. The drought occurred from mid-2019, extending into early 2020, and was characterized by significantly lower-than-average rainfall. The lack of precipitation led to a dramatic reduction in water levels in rivers and lagoons, negatively impacting the diverse and unique ecosystems of the Pantanal.
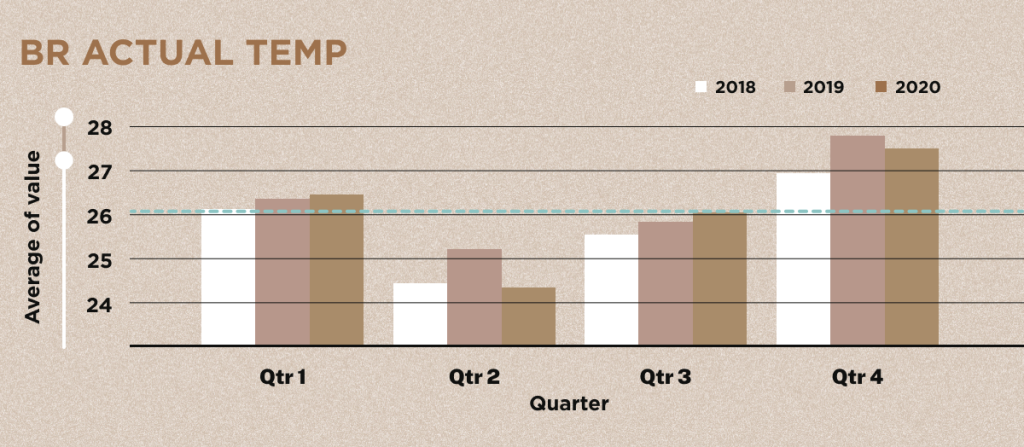
In 2019, there was an overall increase in temperatures, particularly in the second and fourth quarters, compared to surrounding periods. Precipitation data highlighted notably lower levels during the 2nd, 3rd, and 4th quarters of 2019 compared to adjacent years.
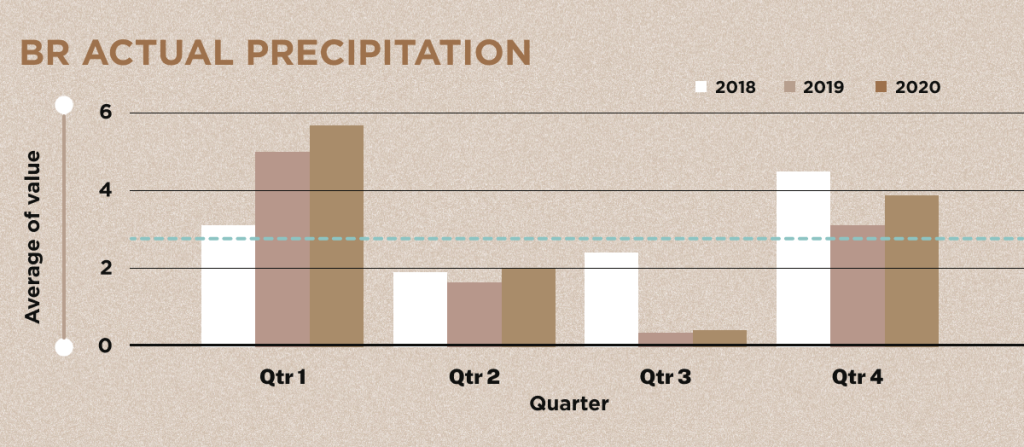
Diving into the meteorological account of 2019, a distinct rhythm unfolds as we focus on precipitation data, specifically in the 2nd, 3rd, and 4th quarters, which notably differs from surrounding periods. Here’s the breakdown:
- 2nd Quarter (2019): Recorded a mere 1.60 mm, contrasting with 1.89 mm (2018) and 1.99 mm (2020).
- 3rd Quarter (2019): A modest 0.33 mm, diverging from 2.38 mm (2018) and 0.37 mm (2020).
- 4th Quarter (2019): Witnessed 3.08 mm, noticeably lower than 4.45 mm (2018) and 3.83 mm (2020).
This underscores a consistent trend of lower precipitation during these quarters in 2019 compared to the adjacent years.
In summary, the climatic analysis for 2019 reveals distinct patterns in both temperature and precipitation. The year is marked by generally higher temperatures, particularly in the second and fourth quarters. Additionally, the precipitation data underscores consistently lower levels during various quarters in 2019 compared to surrounding periods. These observations offer a comprehensive overview of the climatic characteristics of 2019, emphasizing temperature elevation and reduced precipitation in specific quarters.
Current Drought in the Amazonian Area
In recent times, another record-breaking drought has hit the Northern and Central-West regions of Brazil. The Amazon State in Brazil has declared a state of emergency for all its municipalities, totaling 62, since October 2023. The Rio Negro in Manaus has recently hit its lowest recorded level since monitoring began 121 years ago in 1902, marking it as the most severe drought on record. The latest Hydrological Monitoring Bulletin indicates that current river levels continue to be exceptionally low for this time of the year, causing ongoing difficulties in accessing numerous communities.
Temperature Surge (2023):
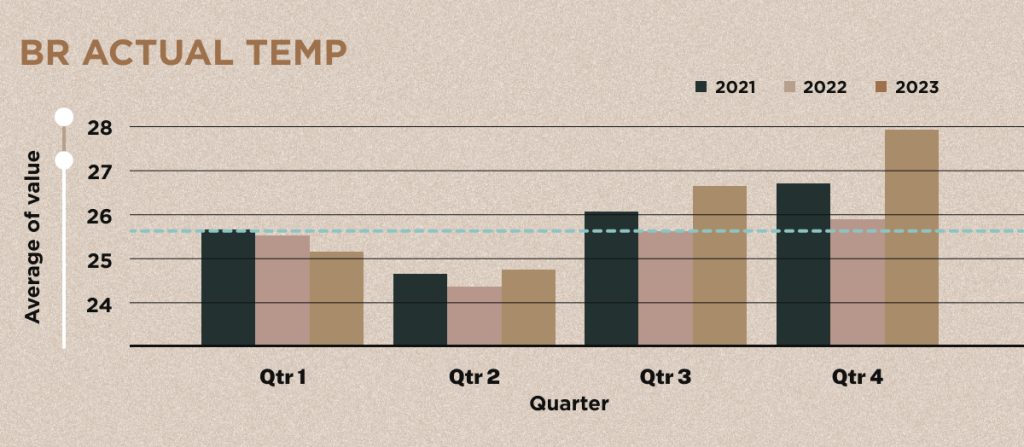
Analyzing the temperature data for 2023, a consistent upward trend unfolds in the second, third, and fourth quarters compared to the preceding two years. Key figures include 24.73°C (Q2), surpassing 24.36°C (2022) and 24.64°C (2021). Additionally, Q3 in 2023 recorded 26.64°C, outpacing 25.62°C (2022) and 26.05°C (2021). The trend continues in Q4 with a high of 27.95°C, exceeding 25.90°C (2022) and 26.70°C (2021). These findings underscore a consistent temperature increase throughout 2023.
Humidity Drop (Q4 2023):
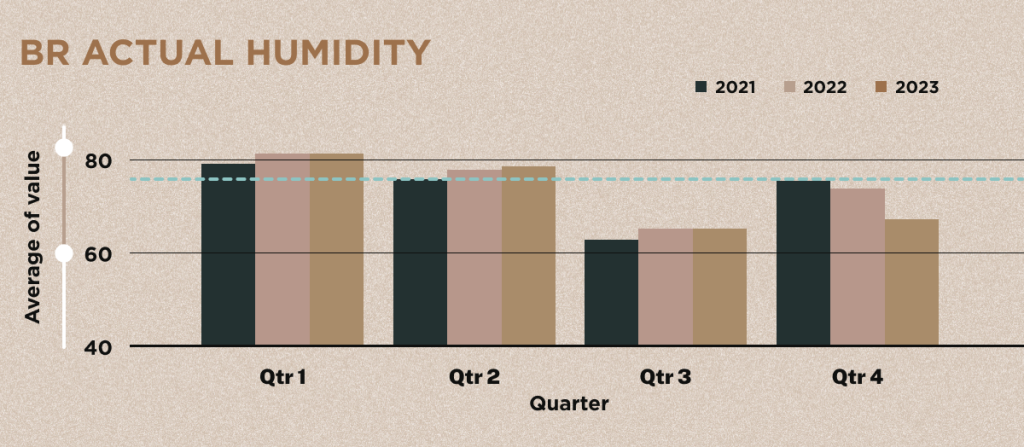
In the fourth quarter of 2023, humidity saw a notable drop compared to the previous two years. Specifically, the recorded 67.0% contrasts with 73.6% (2022) and 75.3% (2021), indicating lower humidity during this quarter in 2023.
Precipitation Plunge (2023):
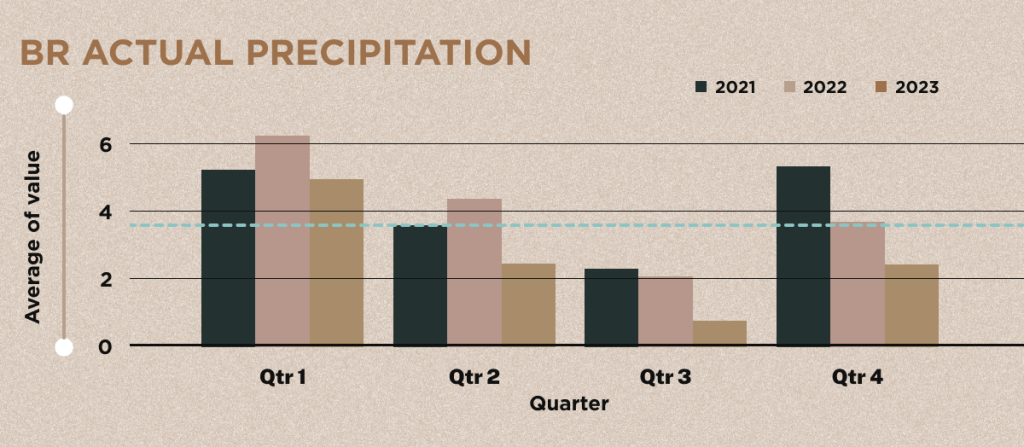
An in-depth look at precipitation data for 2023 reveals consistently lower levels across all quarters compared to the previous two years:
- Q1: 4.92 mm (2023) vs. 6.19 mm (2022) and 5.19 mm (2021).
- Q2: 2.43 mm (2023) vs. 4.35 mm (2022) and 3.52 mm (2021).
- Q3: 0.71 mm (2023) vs. 2.02 mm (2022) and 2.25 mm (2021).
- Q4: 2.39 mm (2023) vs. 3.66 mm (2022) and 5.30 mm (2021).
These findings underscore a consistent trend of lower precipitation levels throughout the specified quarters in 2023 compared to the preceding two years.
In 2023, distinct climatic patterns emerge in temperature, humidity, and precipitation compared to the previous two years. The year features consistently higher temperatures throughout all quarters, especially in the second, third, and fourth quarters. Humidity, notably lower in the fourth quarter, departs from the corresponding periods in 2022 and 2021. Moreover, precipitation levels consistently decrease in all quarters of 2023, signifying reduced rainfall compared to the preceding years. These observations collectively define the unique climatic characteristics of 2023.
Drought Comparison
Let’s compare the severity of the three drought events—2015 Amazonian Brazil drought, 2019 Pantanal drought, and the ongoing drought in the Amazonian area (2023)—based on temperature, humidity, and precipitation.
Temperature:
- For the 2015 Amazonian Brazil drought, the peak temperature reached 28.16 °C in October 2015.
- During the 2019 Pantanal drought, the average temperature for Q4 was 27.78 °C.
- In the ongoing Amazonian drought of 2023, Q4 recorded the highest temperature at 27.95 °C.
Comparatively, the temperatures for the three droughts are relatively close, with the 2015 Amazonian Brazil drought experiencing the highest peak temperature.
Humidity:
- The 2015 Amazonian Brazil drought exhibited consistently lower humidity in the 3rd and 4th Quarters, with an average of 70.17% in Q4.
- The 2019 Pantanal drought showed no specific information about humidity.
- In the ongoing Amazonian drought of 2023, Q4 recorded a humidity level of 67.0%.
Based on the available data, the 2015 Amazonian Brazil drought had the lowest average humidity, followed by the ongoing Amazonian drought in 2023.
Precipitation:
- The 2015 Amazonian Brazil drought had the lowest precipitation in Q4, with an average of 2.60 mm.
- The 2019 Pantanal drought experienced lower precipitation in the 2nd, 3rd, and 4th Quarters, with the lowest being 0.33 mm in Q3.
- The ongoing Amazonian drought in 2023 recorded the lowest precipitation across all quarters, with the lowest being 0.71 mm in Q3.
Comparatively, the ongoing Amazonian drought in 2023 has consistently lower precipitation levels across all quarters, making it the most severe in terms of precipitation scarcity.
Summary
In summary, while the 2015 Amazonian Brazil drought had the highest peak temperature, the ongoing Amazonian drought in 2023 appears to be the most severe in terms of both humidity levels and precipitation scarcity. All in all, while the 3 droughts had similar patterns, their impacts were slightly different due to the specifics of the metrics and location of droughts, showcasing the variability in the impact of droughts on different regions. Nevertheless, the current Amazonian drought is proving to be one of the most severe droughts Brazil has faced even when compared to the other 2 major droughts, which have potential ramifications on its agriculture sector, economy, and political landscape.
References
https://www.nature.com/articles/s41467-021-22840-7
Disclaimer
Please refer to our terms and conditions for the full disclaimer for Stoic Capital Pte Limited (“Stoic Capital”). No part of this article can be reproduced, redistributed, in any form, whether in whole or part for any purpose without the prior consent of Stoic Capital. The views expressed here reflect the personal views of the staff of Stoic Capital. This article is published strictly for general information and consumption only and not to be regarded as research nor does it constitute an offer, an invitation to offer, a solicitation or a recommendation, financial and/or investment advice of any nature whatsoever by Stoic Capital. Whilst Stoic Capital has taken care to ensure that the information contained therein is complete and accurate, this article is provided on an “as is” basis and using Stoic Capital’s own rates, calculations and methodology. No warranty is given and no liability is accepted by Stoic Capital, its directors and officers for any loss arising directly or indirectly as a result of your acting or relying on any information in this update. This publication is not directed to, or intended for distribution to or use by, any person or entity who is a citizen or resident of or located in any locality, state, country or other jurisdiction where such distribution, publication, availability or use would be contrary to law or regulation.